- Sparx Maths
What 8.8 million data points tell you
 Amanda Whitehead- Lead Secondary Maths Adviser|November 26, 2025
In July 2022 we launched a KS2-3 transition booklet to support students moving from primary to secondary school. Its popularity prompted us to think about other ways we could support teachers and students.
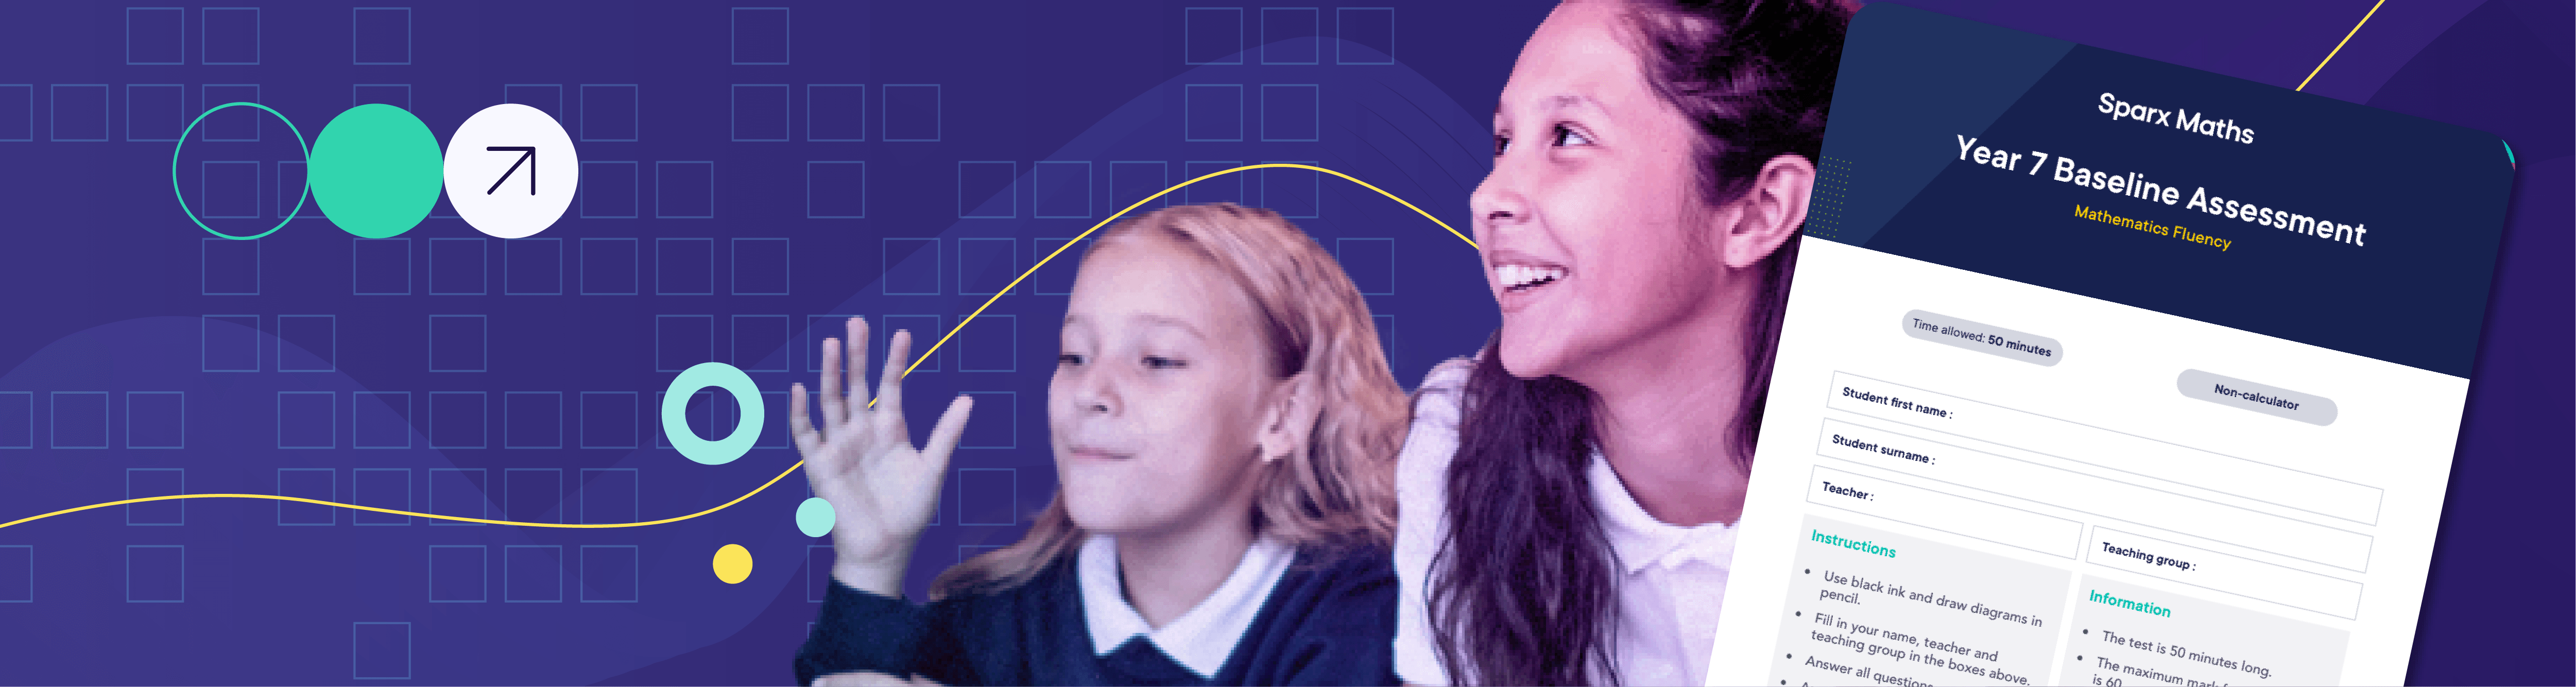
In September 2022 we launched our formative baseline assessment for teachers to use with their year 7 students. The aim was to help teachers identify and close gaps in their students' knowledge, building a secure toolkit of skills that will prepare them to access further teaching in year 7 and beyond.
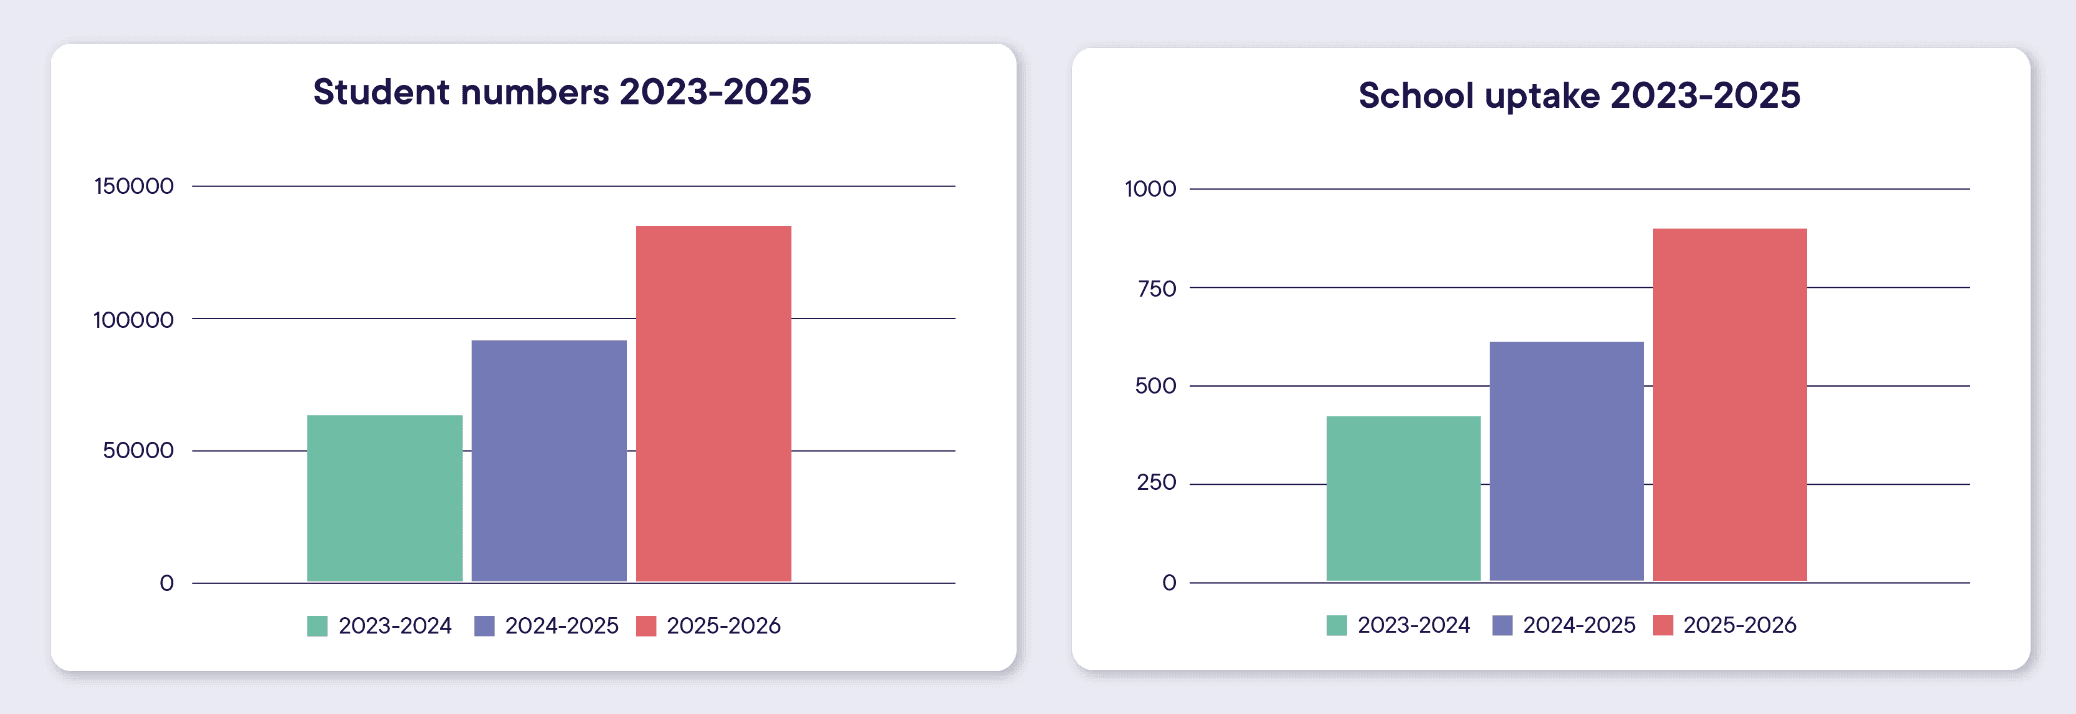
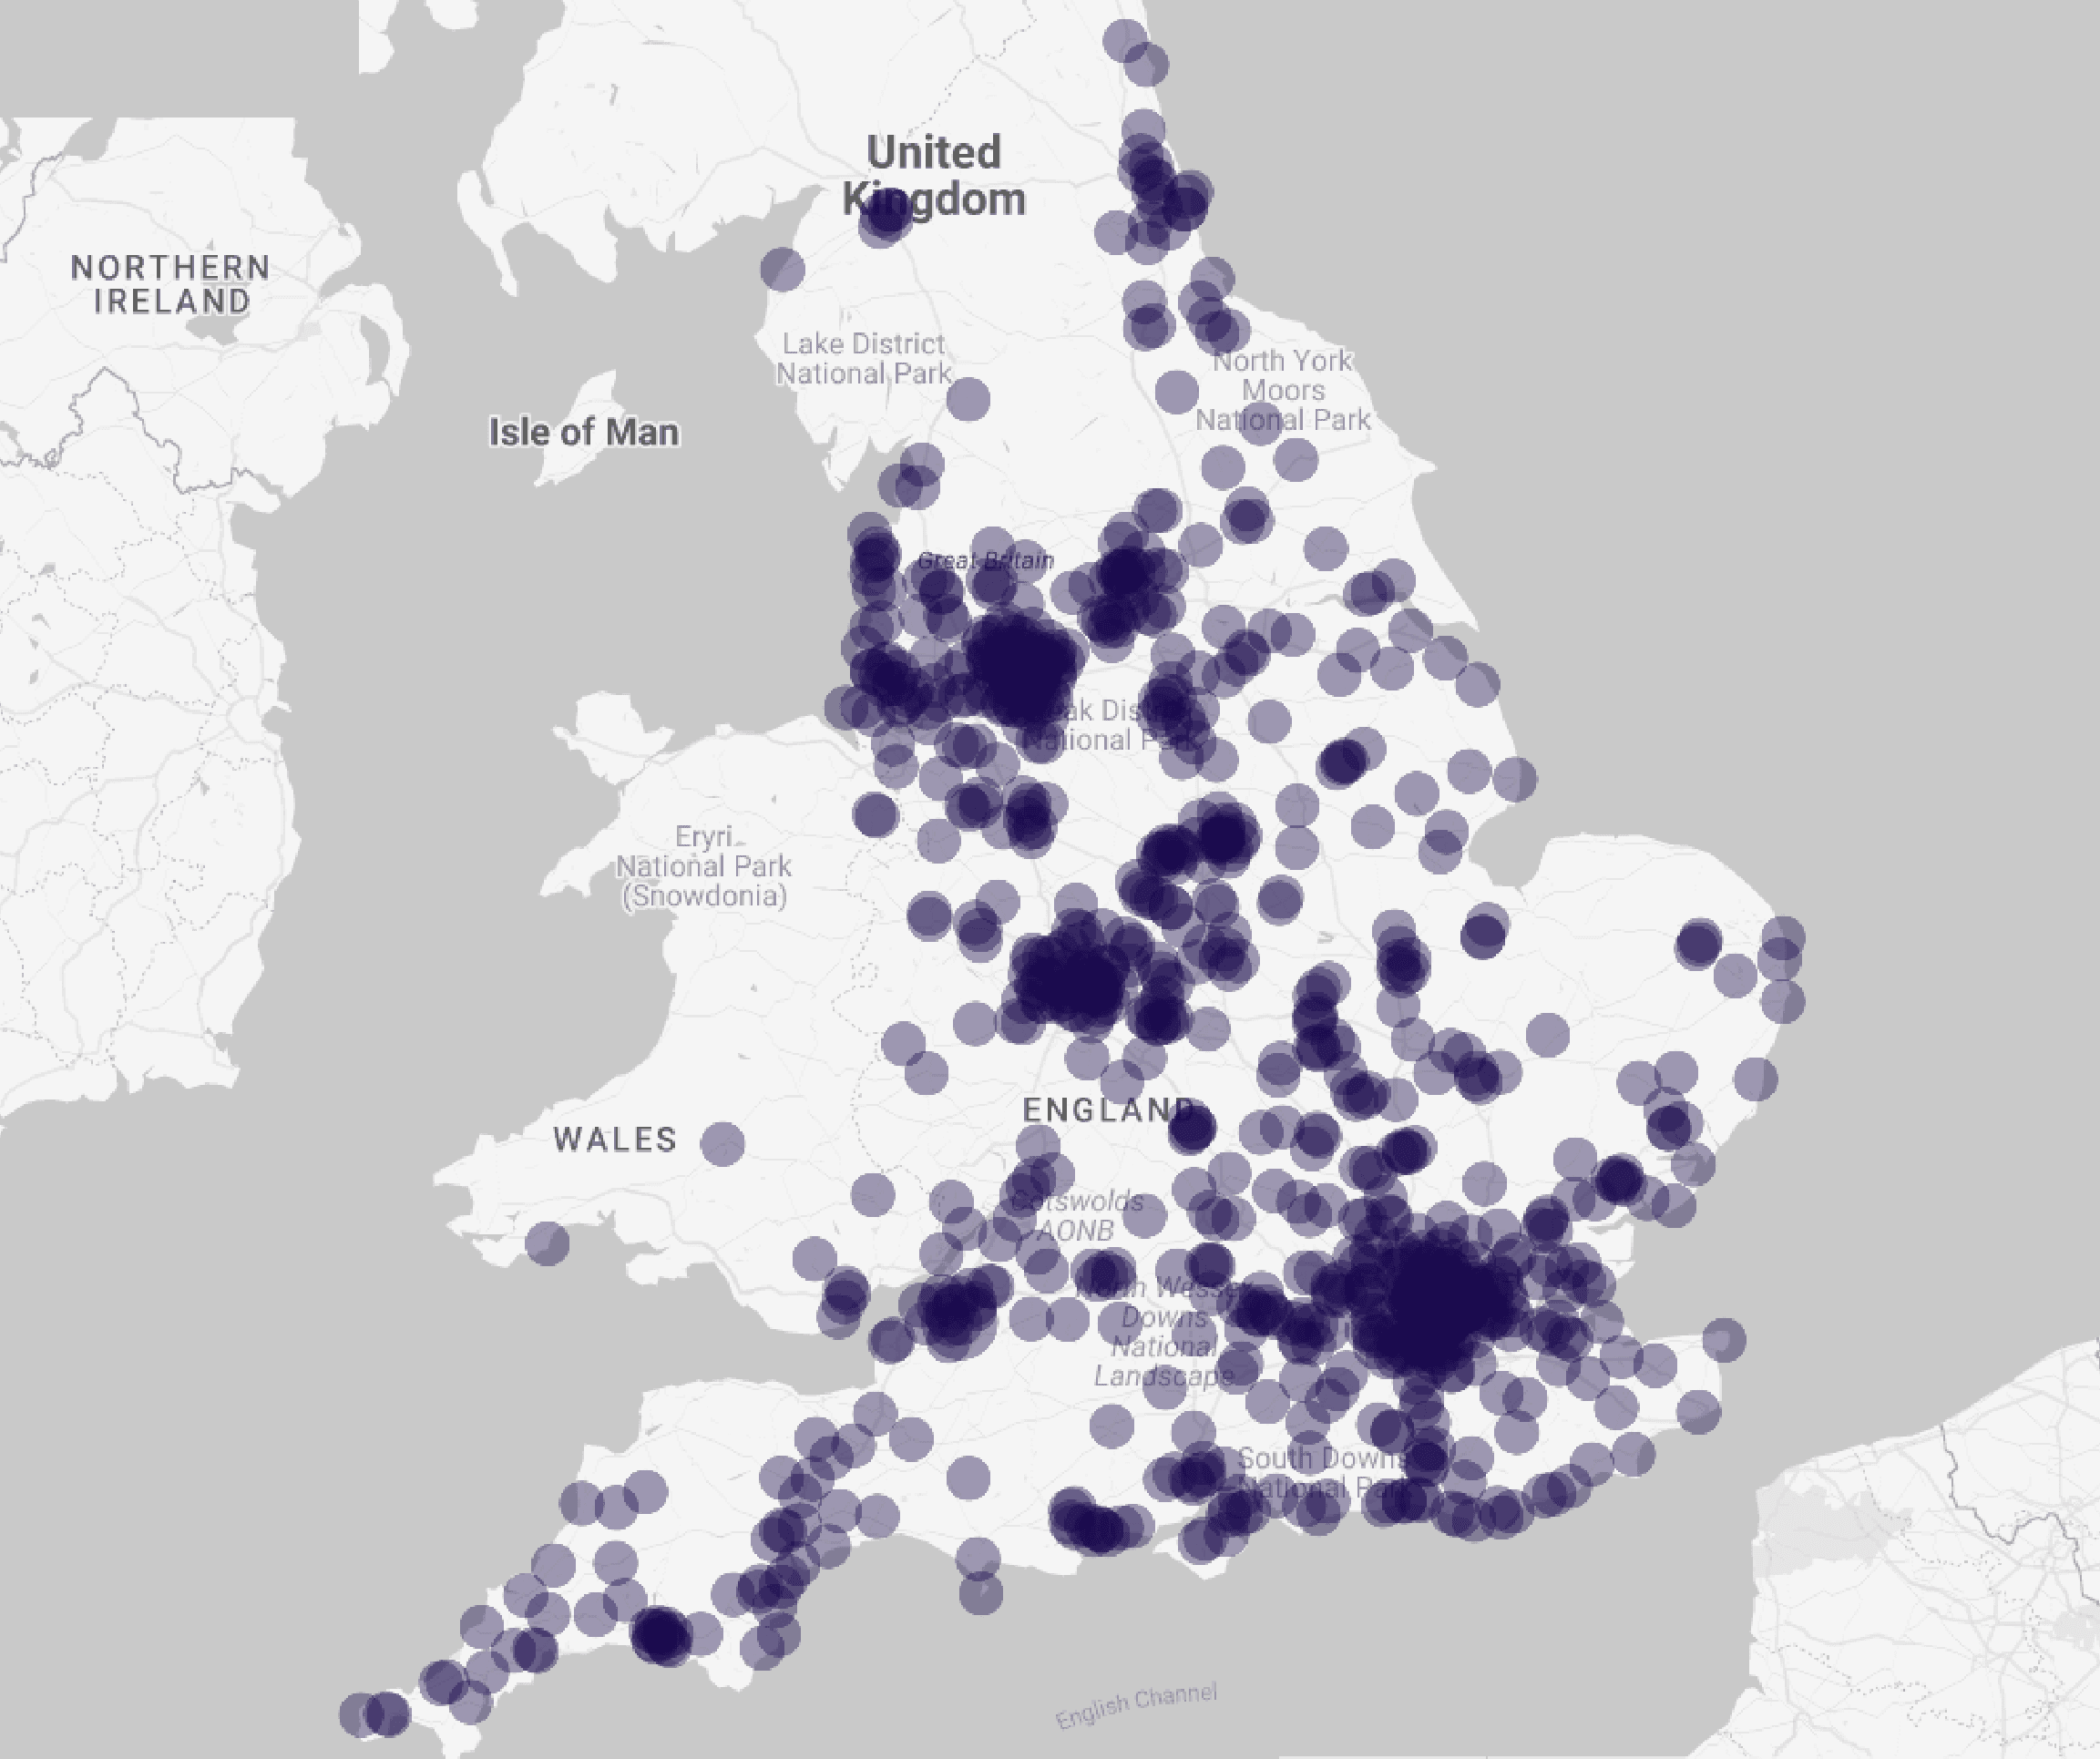
As you can see, the assessment's popularity continues to grow, with schools across the UK participating. By the data entry deadline, QLA data for 146,806 students across 889 schools had been submitted, giving us nearly 9 million data points.
Why do we offer a free baseline?
Whilst teachers have access to students’ SATS results, the expected standard of 100 only tells teachers that students achieved between 58 - 61 marks out of the 110 available across 3 papers (one arithmetic and two reasoning).
There’s not an easy way for schools to get question-level analysis of the SATS papers. As a result, they have limited knowledge about which areas of maths students are strongest at or the concepts they’re struggling with.
Starting year 7 “blind” means many students are retaught areas they already know, resulting in missed opportunities to deepen learning. This can cause maths to lose the excitement it held in primary school, particularly for disadvantaged high achievers.
“New research from UCL shows only 9% of disadvantaged pupils with strong maths scores at the end of primary school score go on to get at least a B in maths A-Level. That’s like losing a packed football stadium’s worth of talent every year.” Axiom Maths
It’s staggering that 91% of disadvantaged pupils who were on track to excel in maths, don’t maintain that trajectory between Years 7 and 13. While supporting disadvantaged students is multifaceted, one of the things we can control is ensuring lessons are pitched to keep students engaged and challenged. This is only possible with knowledge and insight into their strengths and weaknesses.
This also affects the other end of the spectrum. Without teachers having knowledge of vulnerable fundamental knowledge, secondary maths can become too hard, too quickly for some students, resulting in the similar “switch off” in Year 7.
Translating an assessment into strategy
From the start of this project, we wanted the assessment to be as formative as possible. Our aim was to give students the opportunity to close gaps in their knowledge that might prevent them from accessing new content in Year 7. In summary, we wanted to help Year 7 secure a toolkit of essential knowledge.
To increase the impact of the baseline assessment even further, this year we have developed a brand new system, Sparx Assessments. When students complete the baseline assessment Sparx Assessments offers:
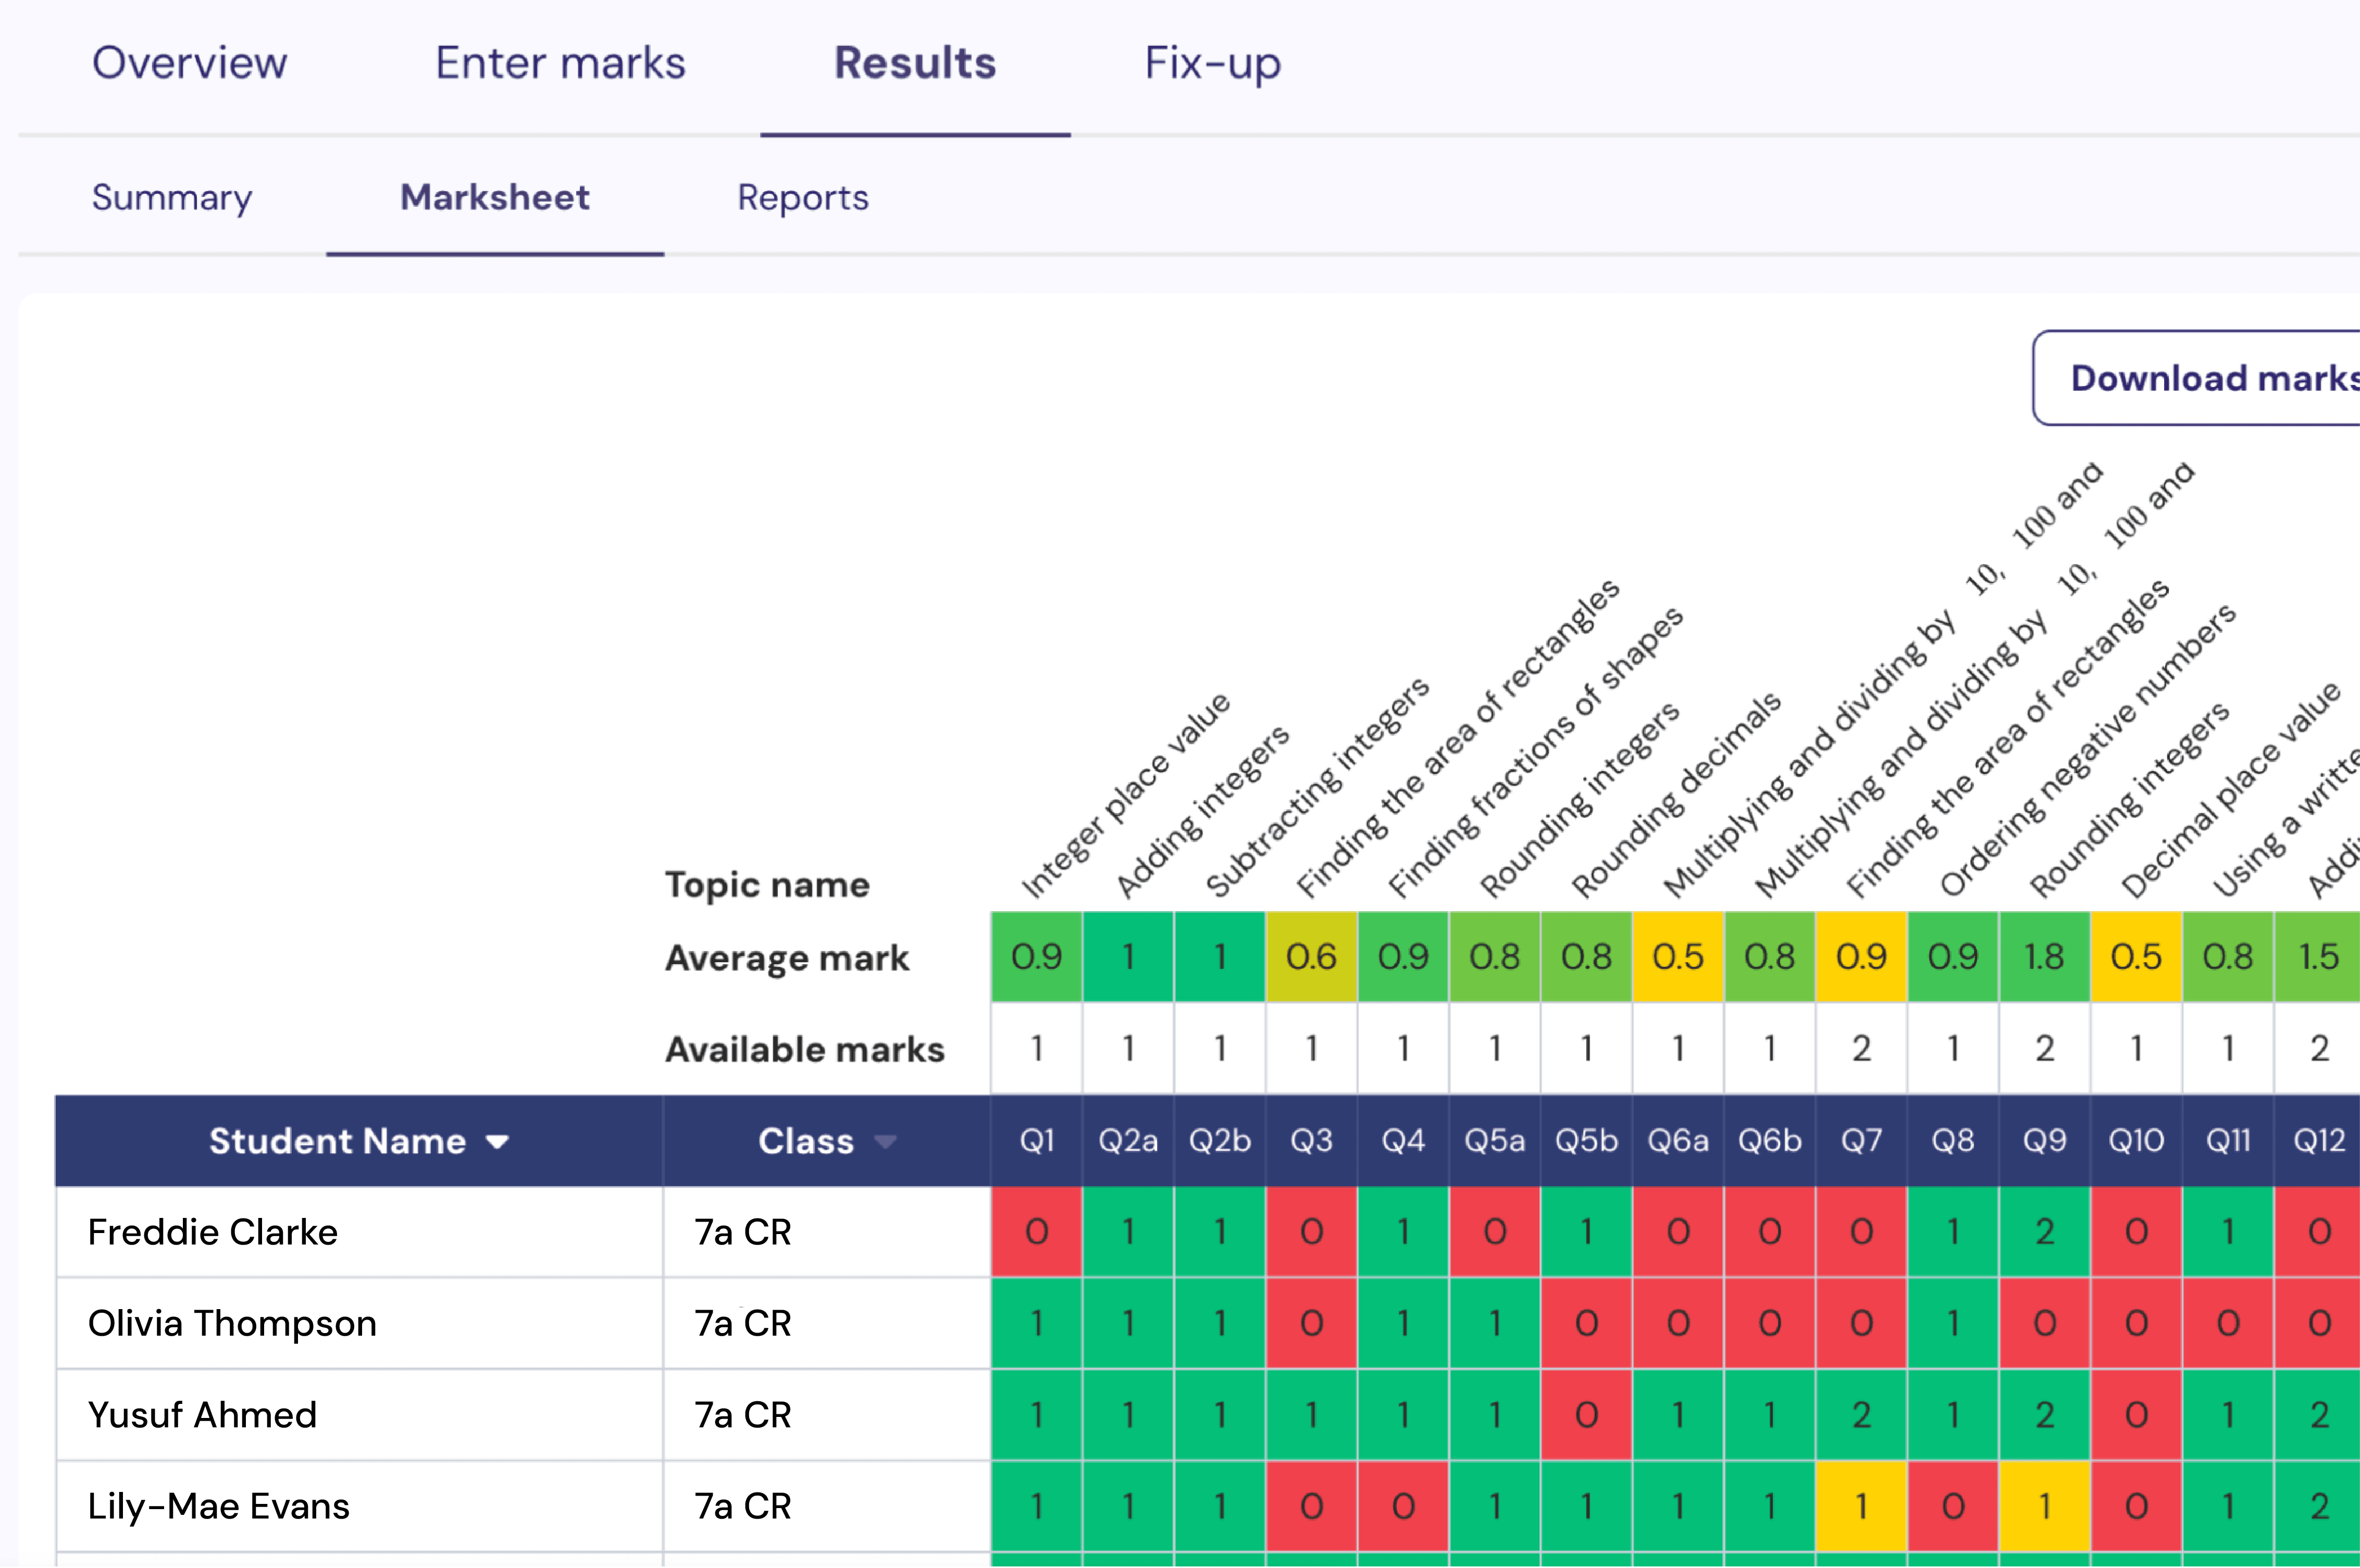
Class level reporting that allows teachers to see the strengths and weaknesses of the group as a whole. Data remains linked to each student, so if the school makes set changes after the assessment, the new teacher can easily see the most relevant data.
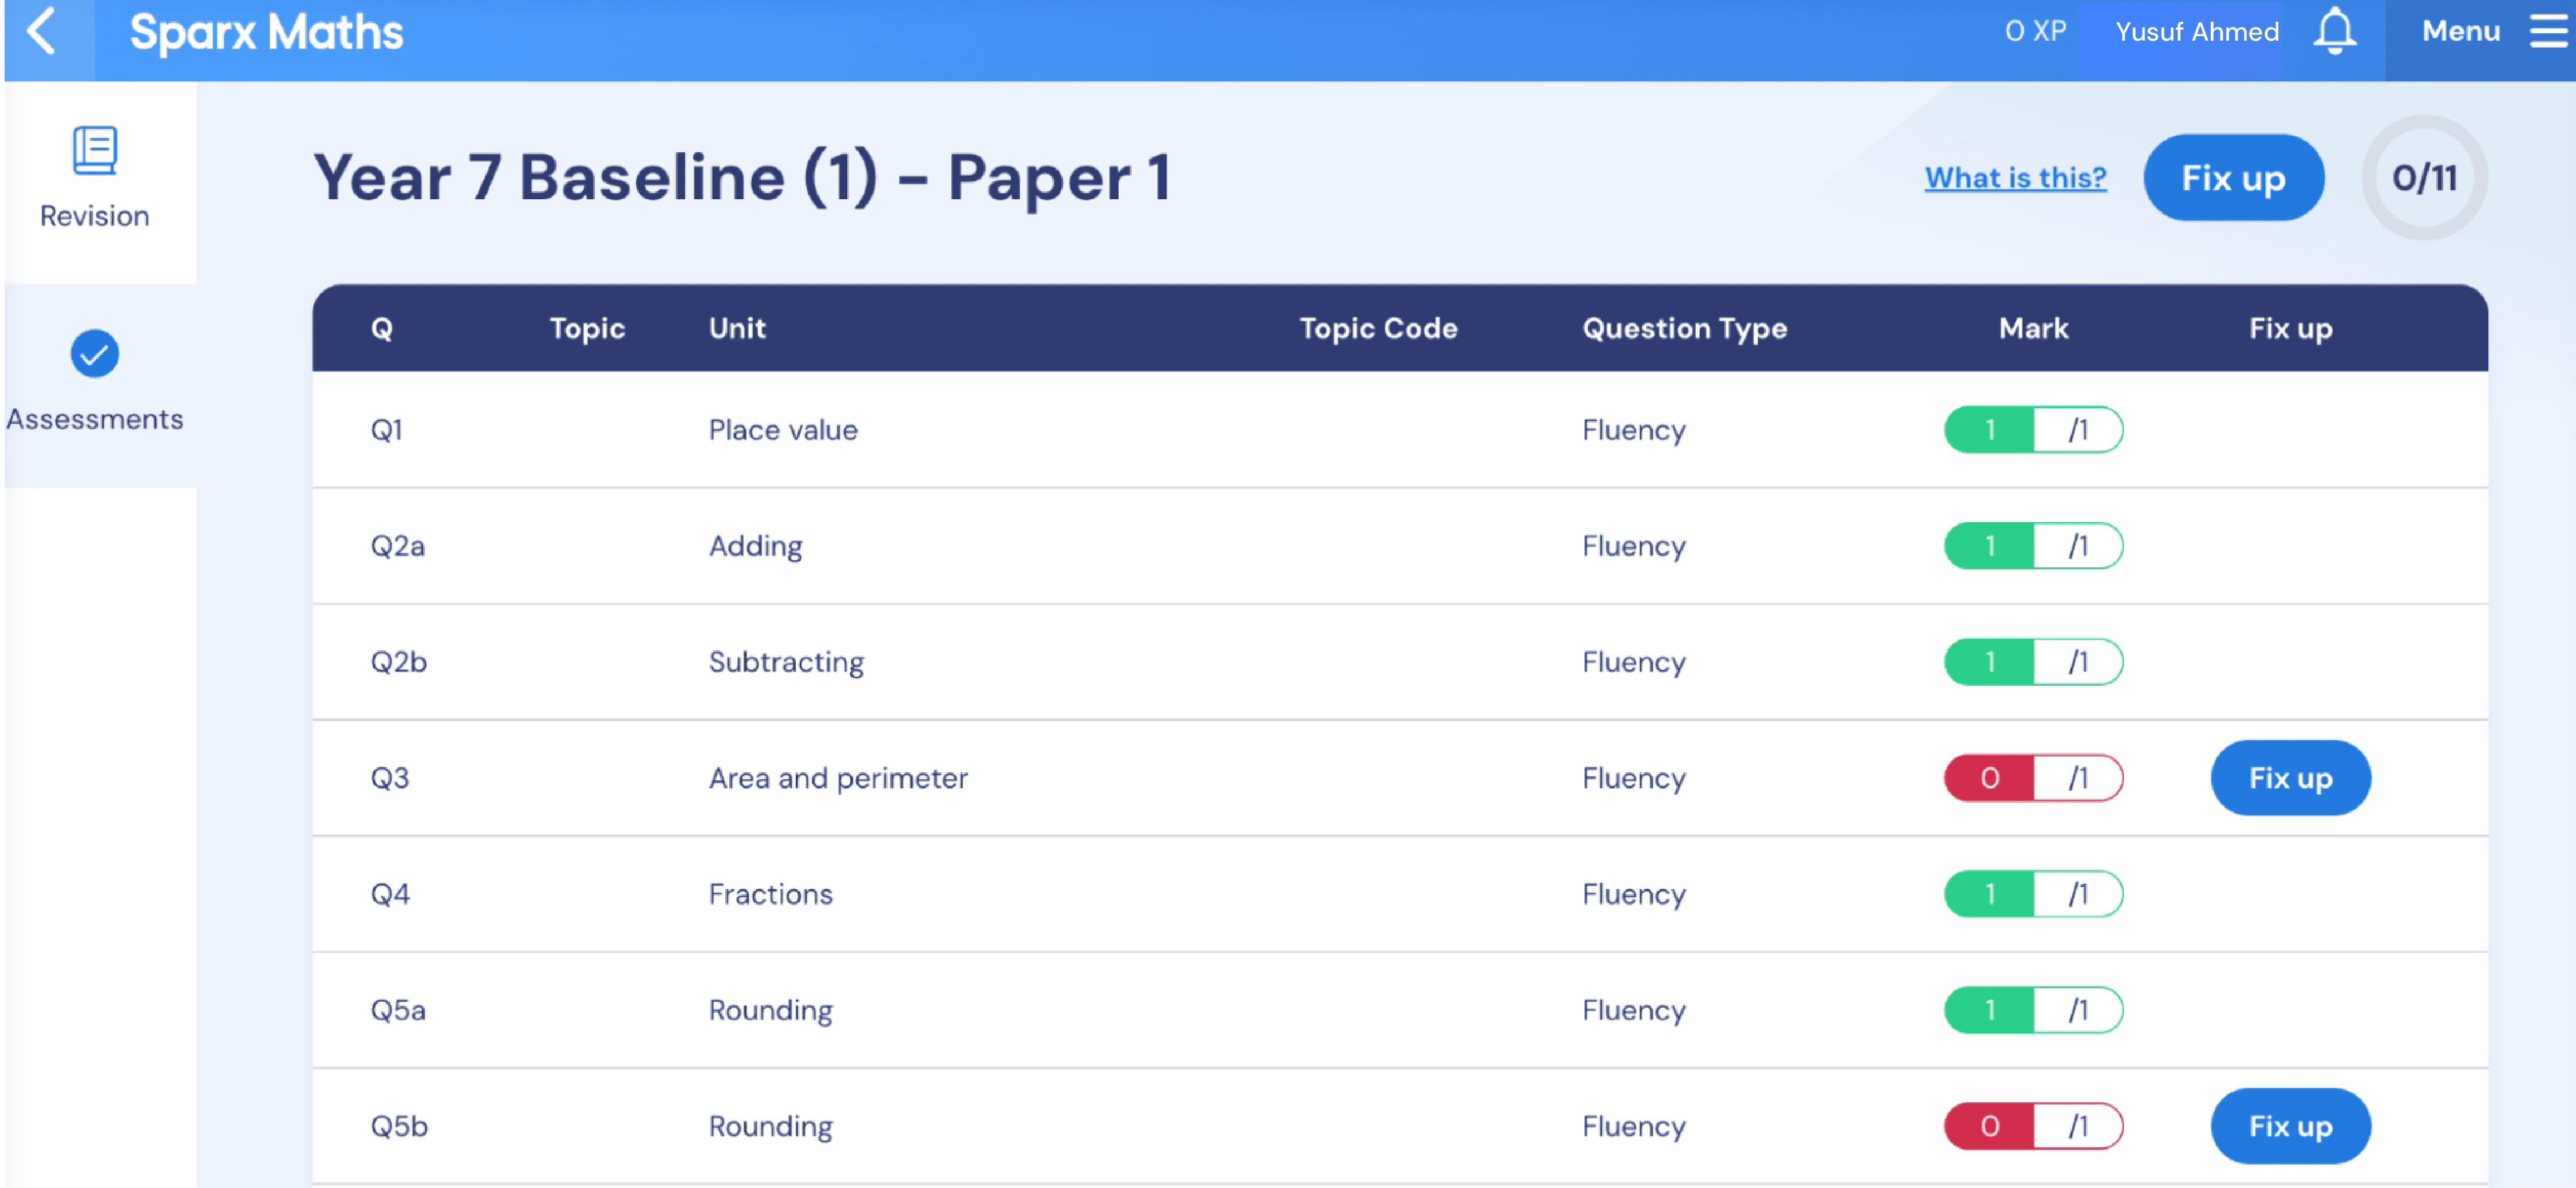
Follow up work (Fix-Up) is available for every student in Year 7. When data is entered into Sparx Assessments, teachers can turn on Fix-Up for their class which provides each student with a shadow version of each fluency question they got wrong in the assessment. This year, teachers have enabled “Fix Up” for 87,684 students across 3,515 classes, allowing them to tackle these gaps.
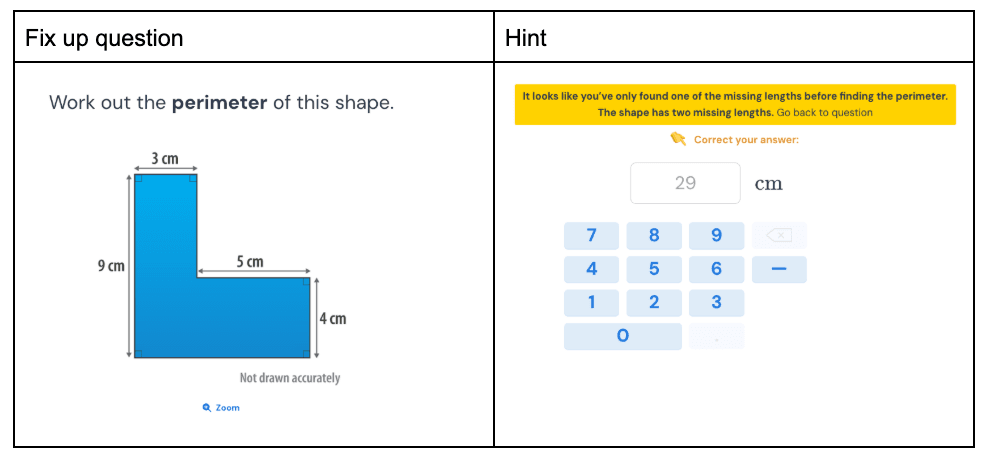
Each fix-up question is supported by a video to help students get the support they need. We’ve also started providing hints to address common misconceptions when students provide certain incorrect answers.
For example, the fix up question for Q31 is shown below. If they give the answer of 29 (missing the vertical missing length) they are shown a hint. Since 16 October 2025, this hint has been delivered to students 8,125 times (across fix up and homework) resulting in a 69.8% success rate compared with 55.1% without the hint.
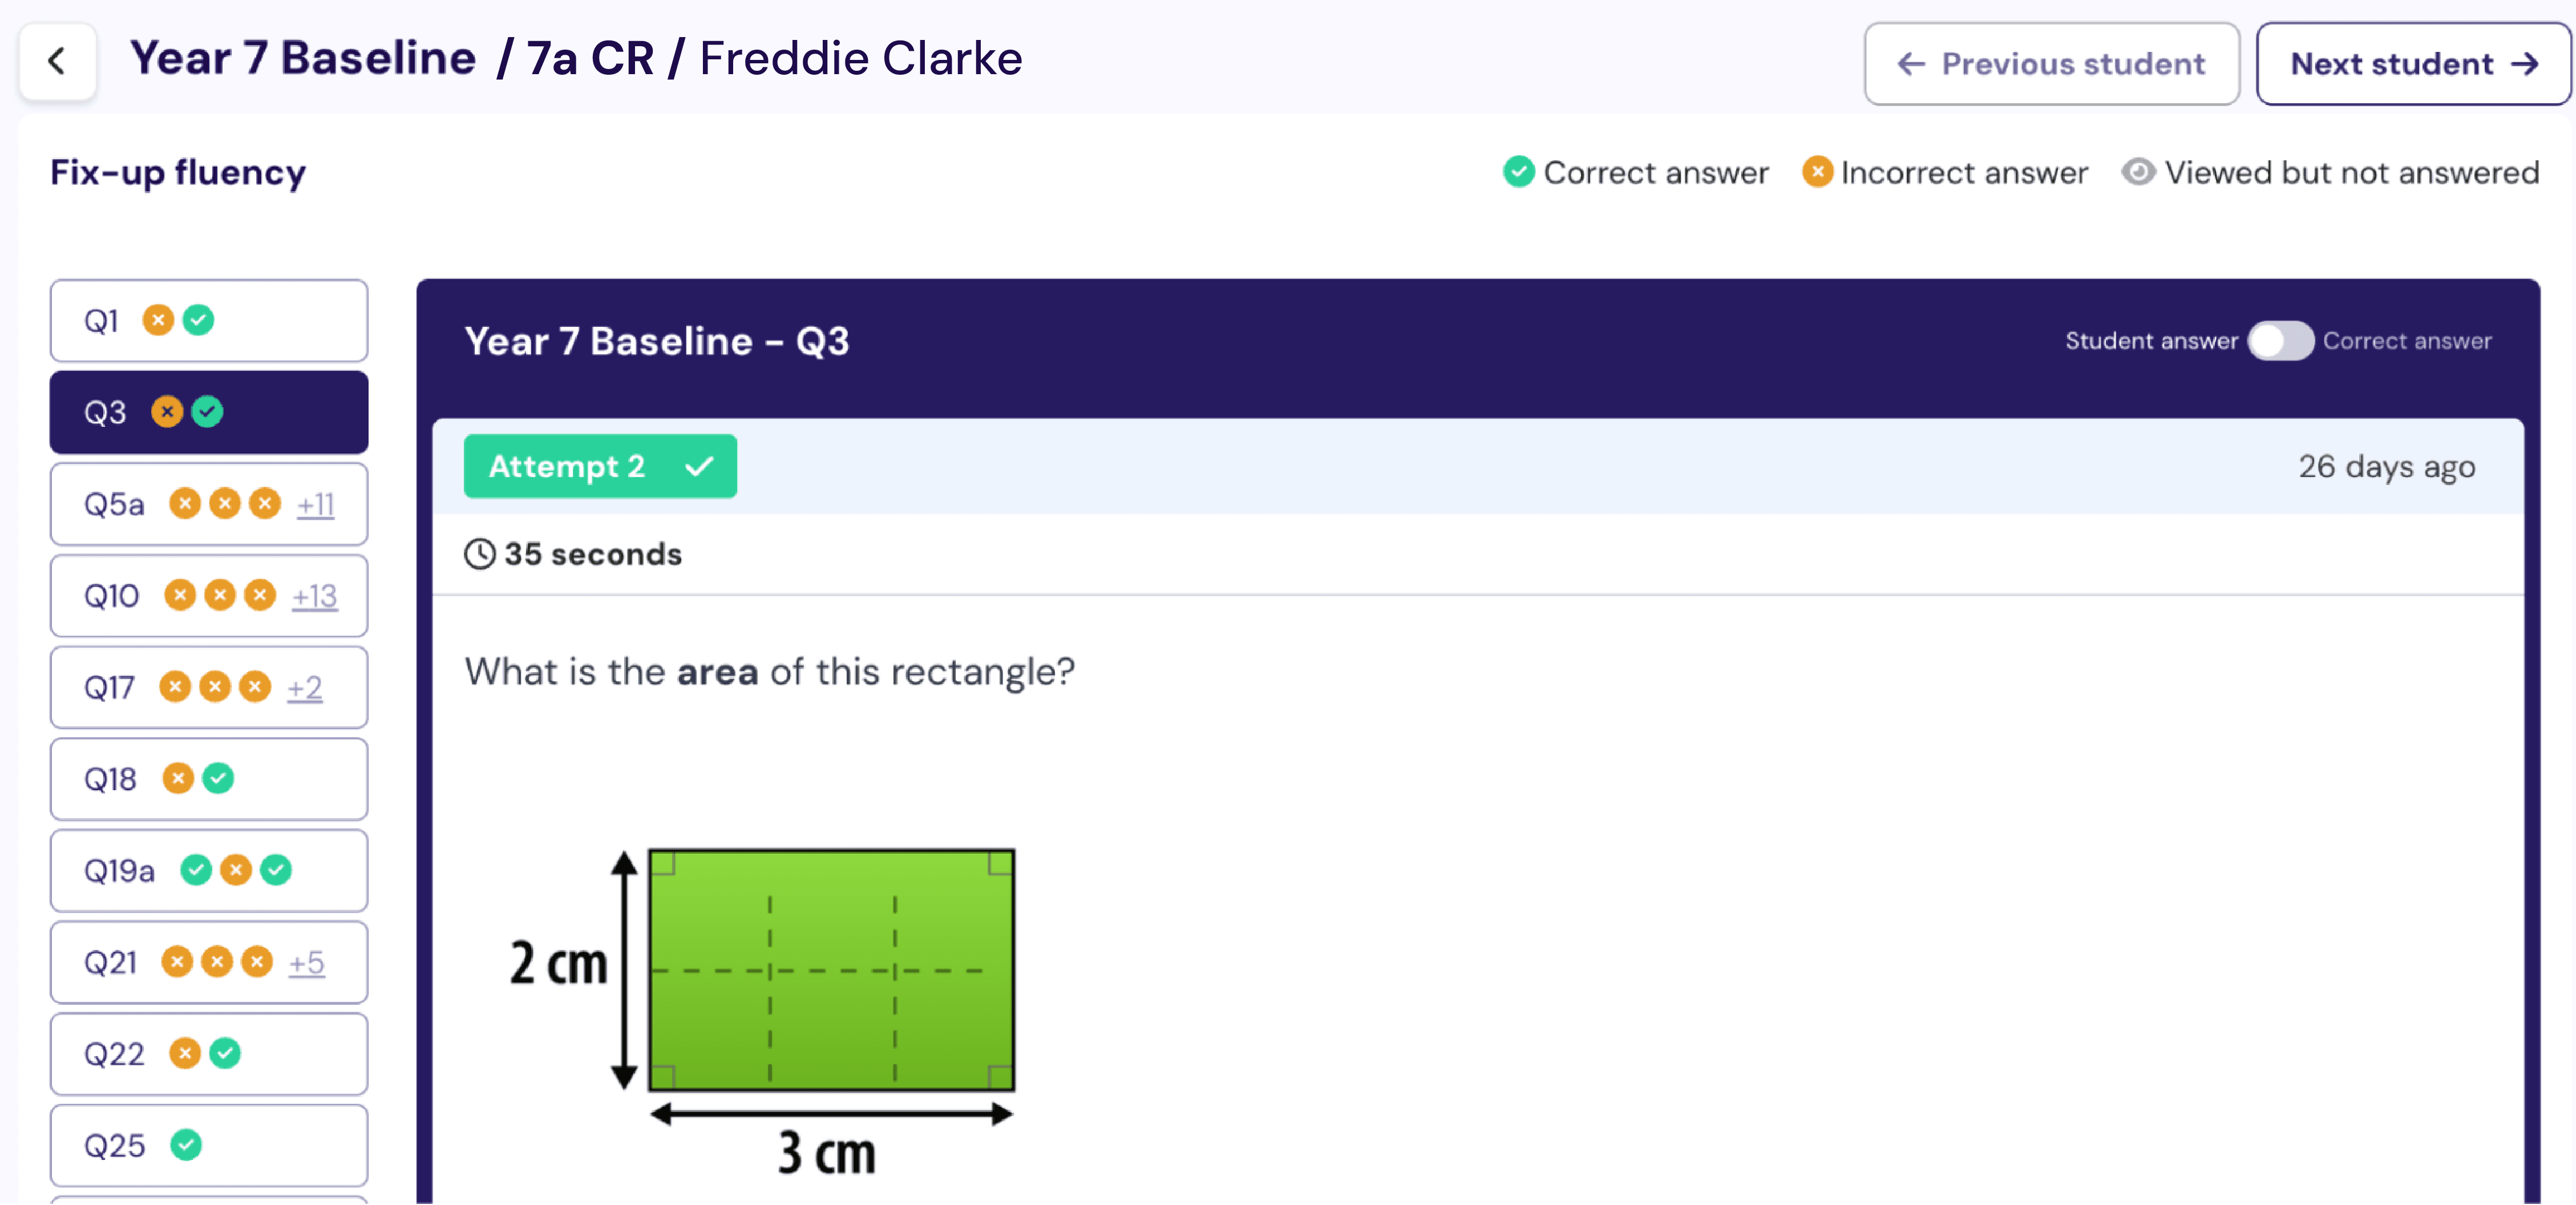
Teachers are able to delve into students’ thinking by seeing their answer history for their fix-up questions, including how many attempts it took them to get it right.
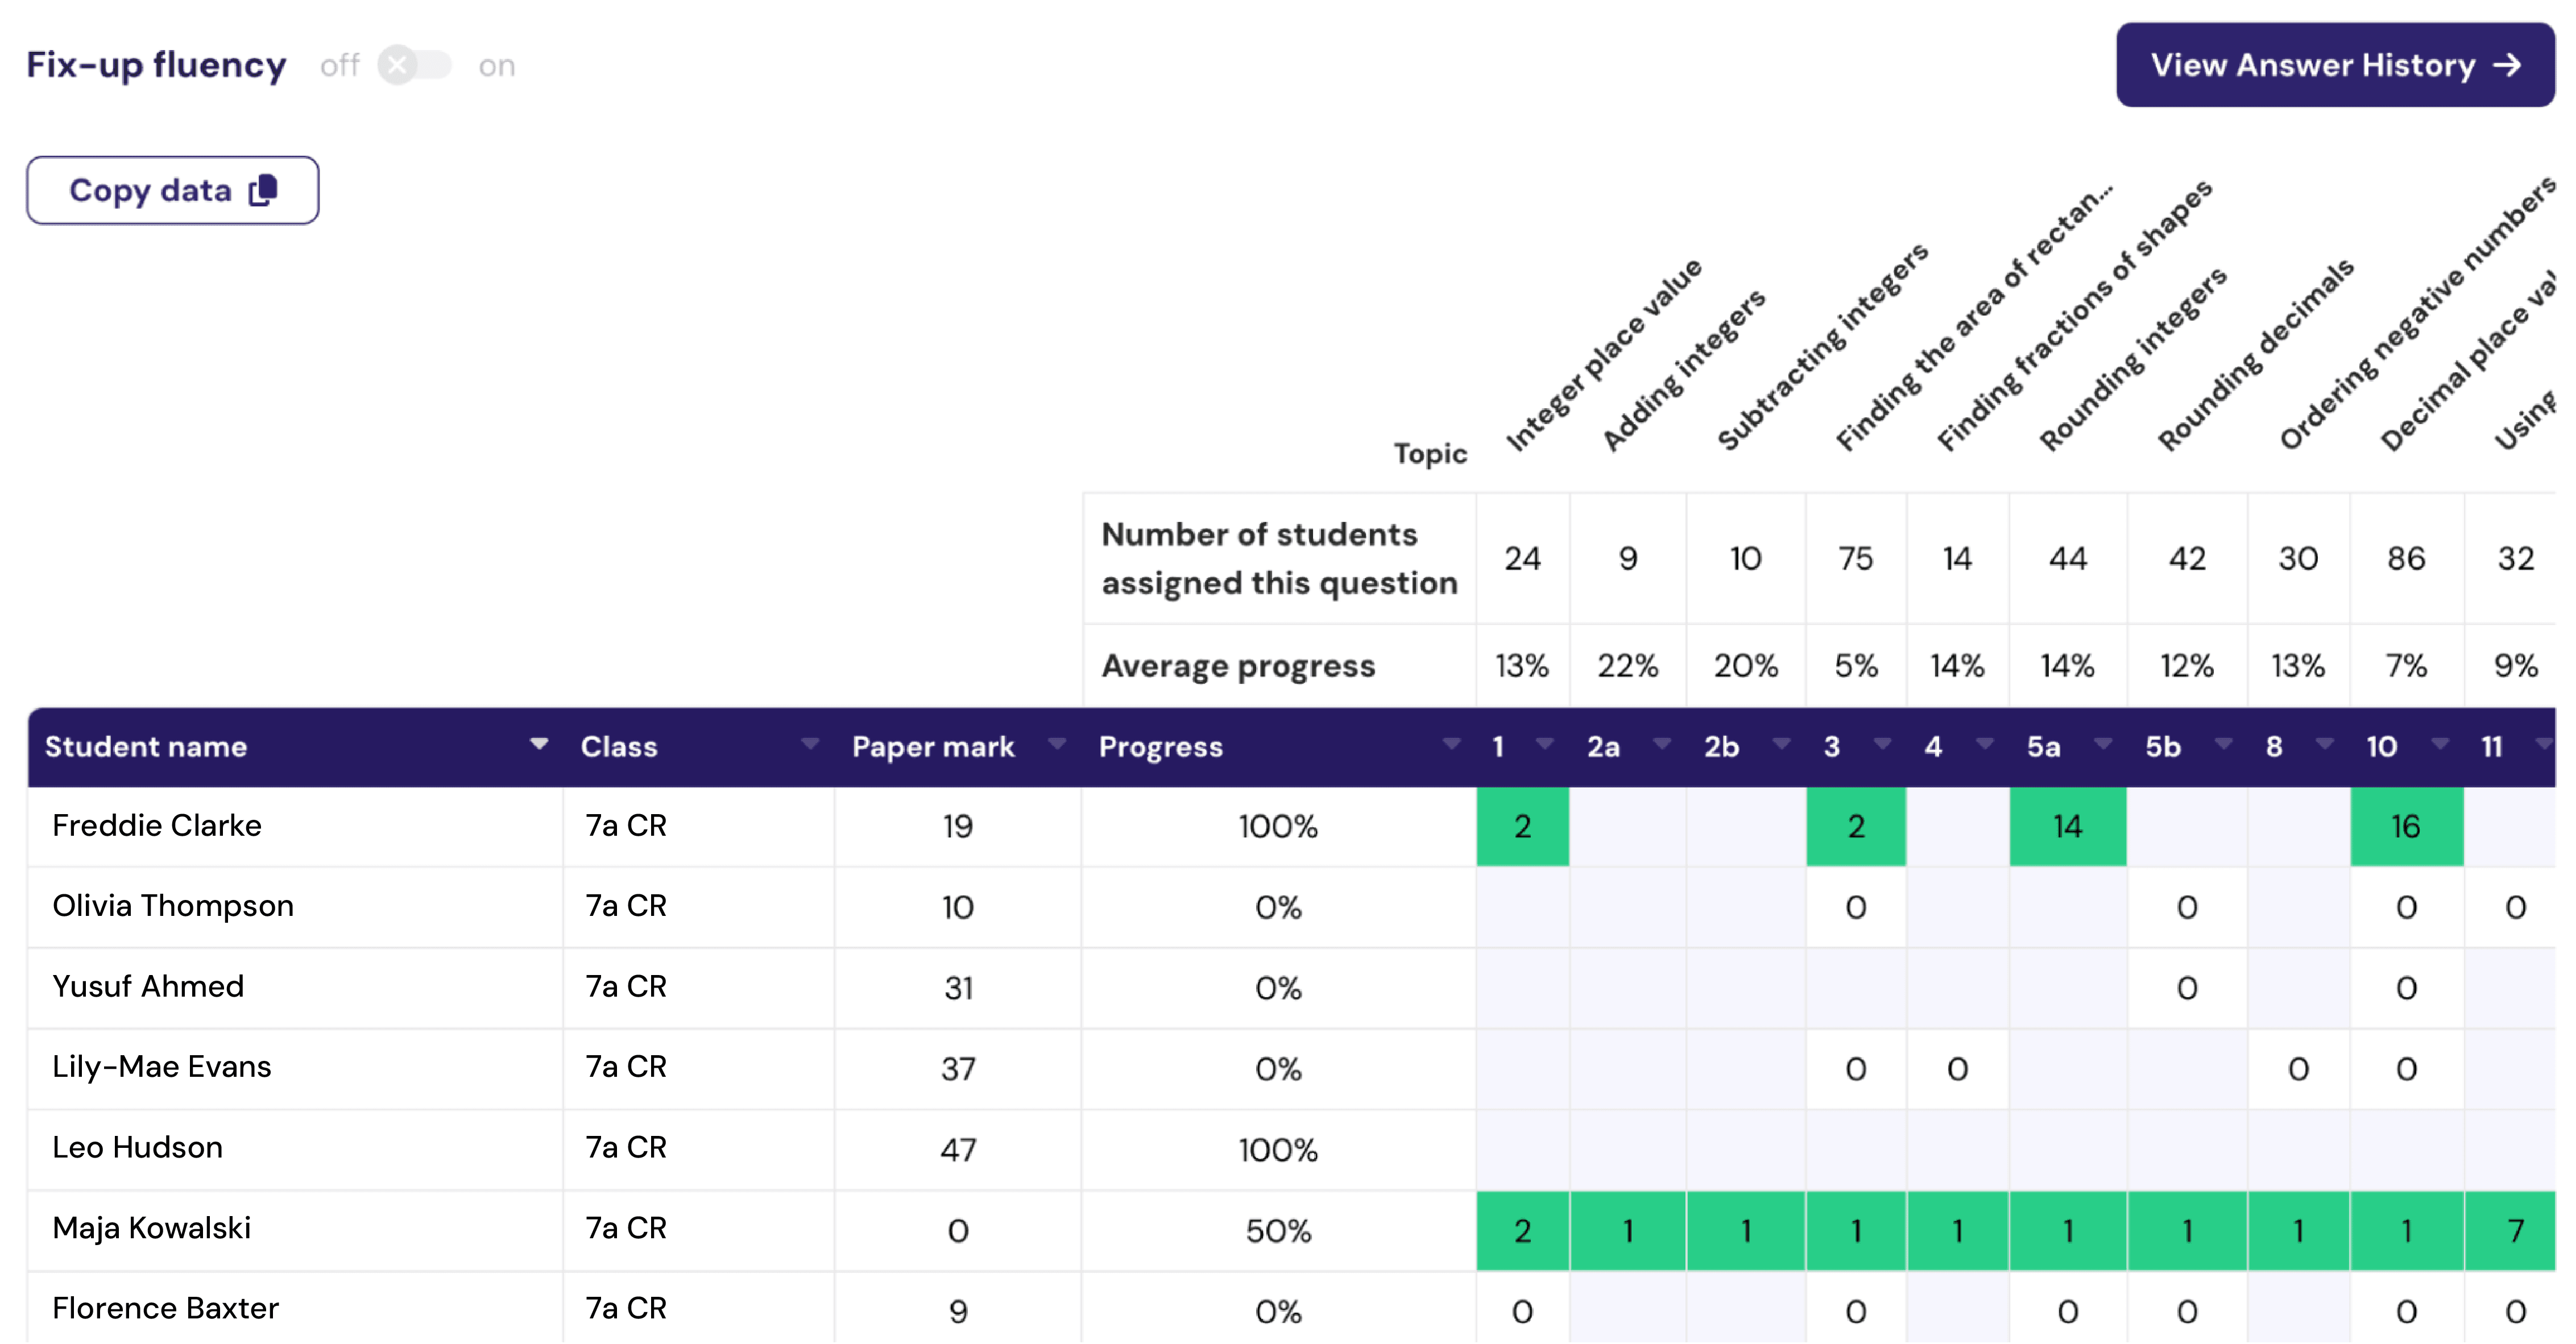
Strengths and weaknesses at a question and topic level are also available to view at a cohort level. This enables heads of department or key stage leaders to adjust schemes of learning where appropriate, or use the students’ data to inform subject and pedagogy sessions at department meetings.
National comparison data
To help schools understand their cohort, we also provide a national comparison report. This allows leaders to see how their students compare to the national profile, at each ability window.
Using the national comparison graph below as an example, this head of department can see that they have more children sitting just below that national average (20-30%). In contrast, the proportion of students achieving 0-9 and 10-19 marks are more in line with national figures. Therefore, the students in the 20 - 29 mark range could be the first wave to receive intervention from this school.
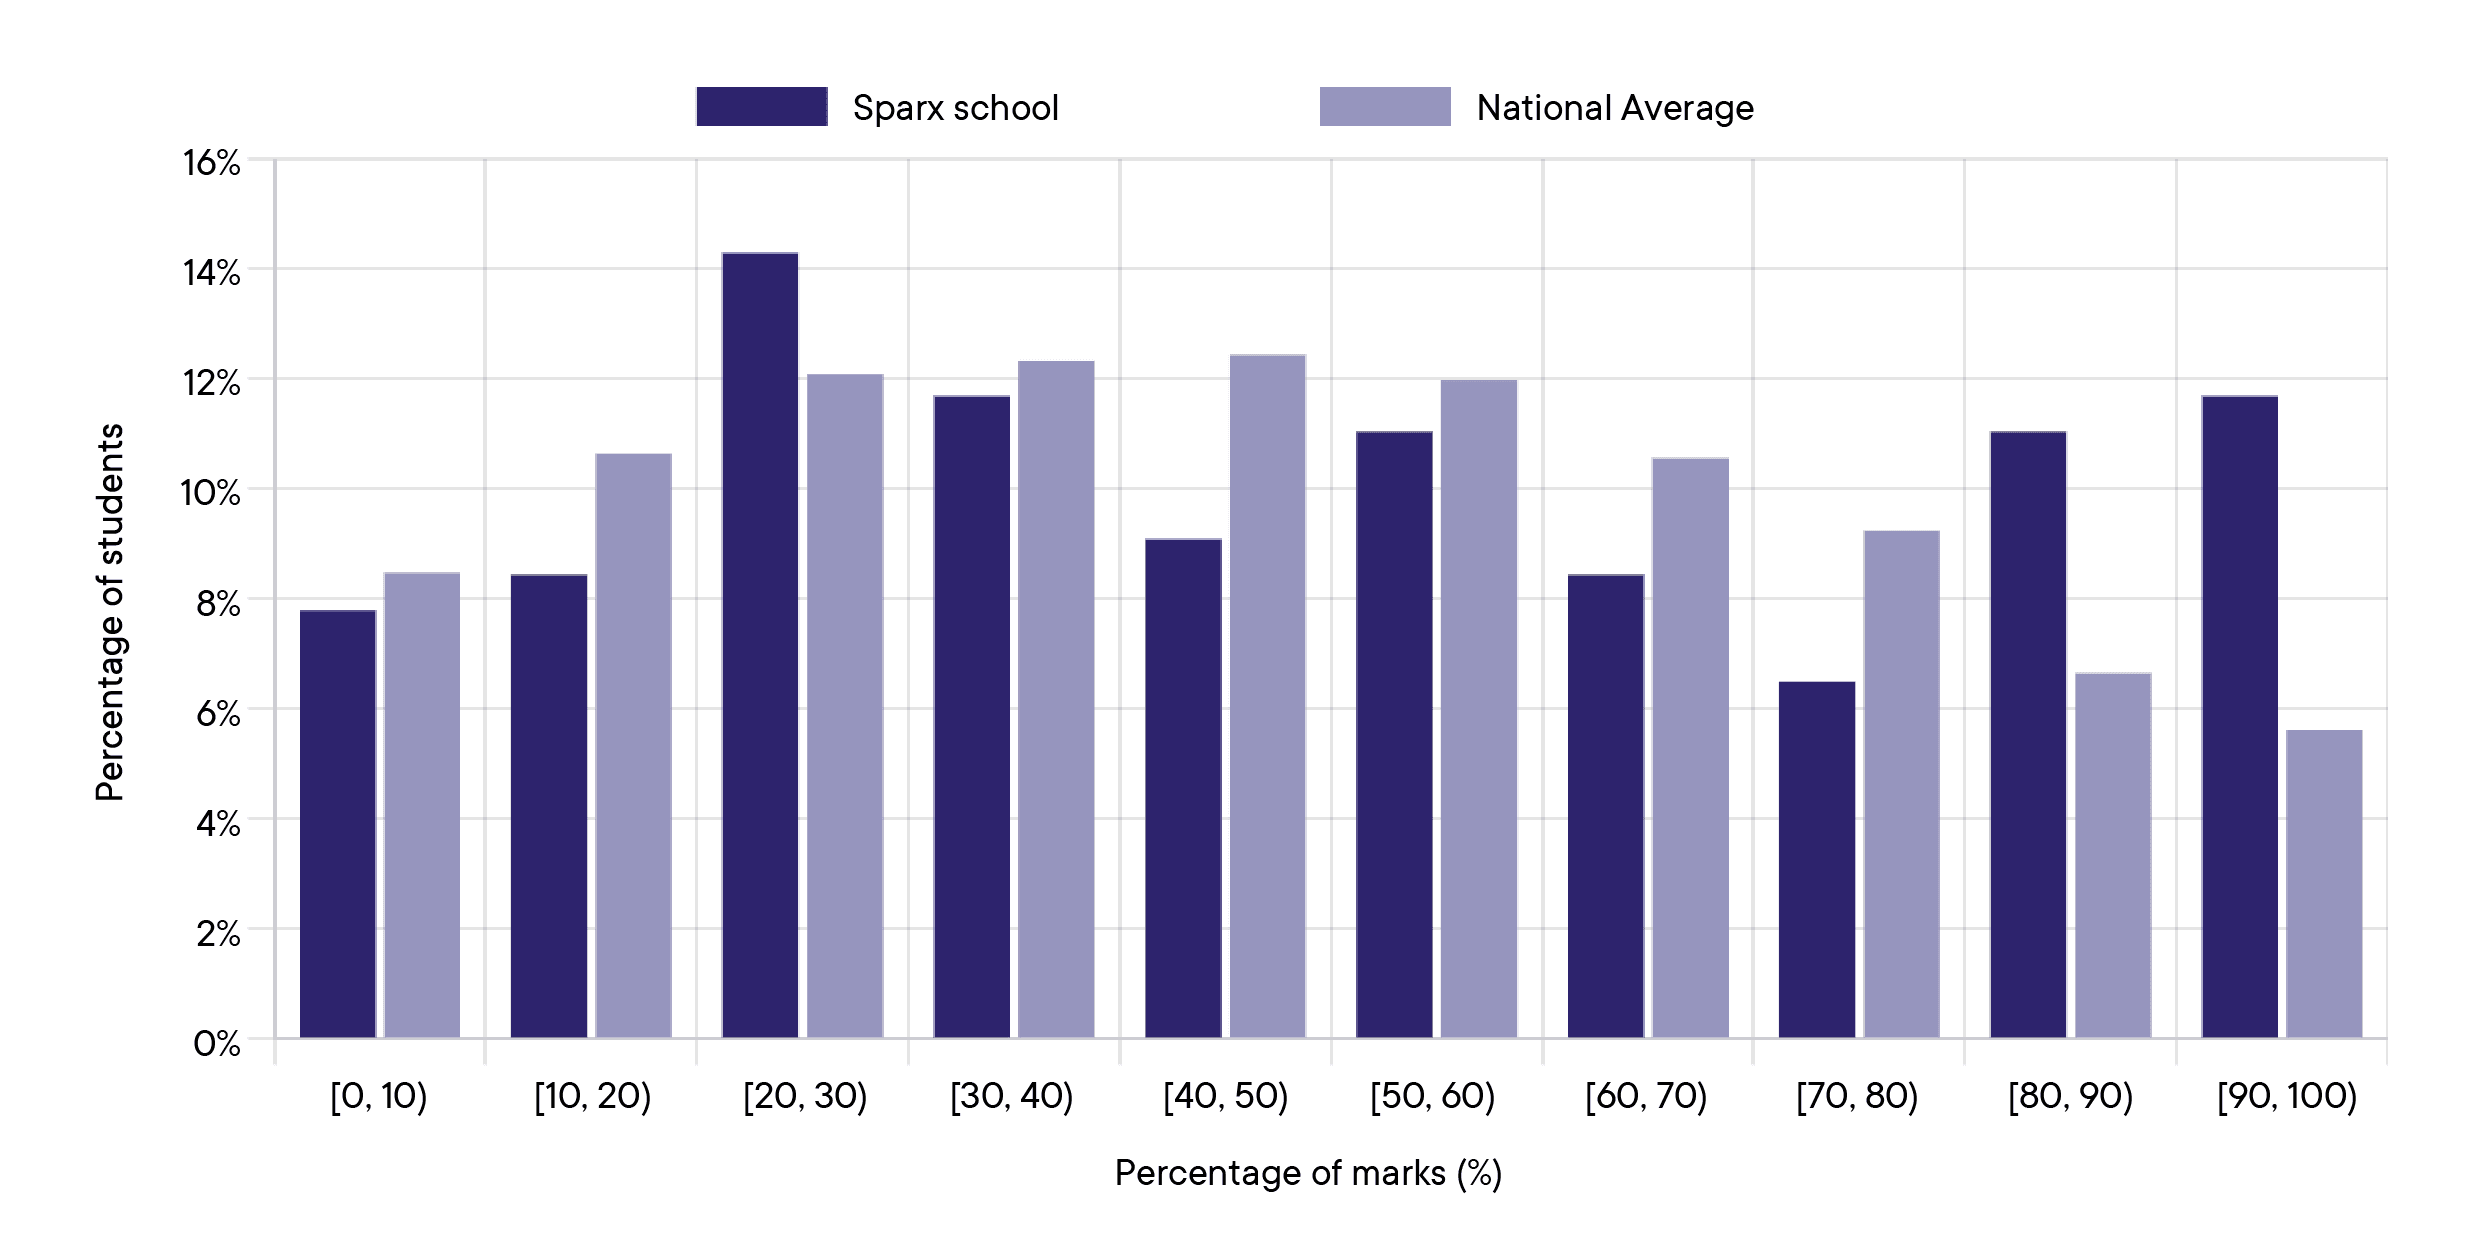
In many schools “Fix-Up” interventions are being set up so that students can close their gaps with a personalised package.
Nationally, what are the strengths and weaknesses in Year 7?
We will now delve a little deeper into the data. How did students perform in the assessment? How are they engaging with their “Fix-Up” work? What sort of misconceptions are we seeing?
The chart below shows the distribution of total marks awarded.
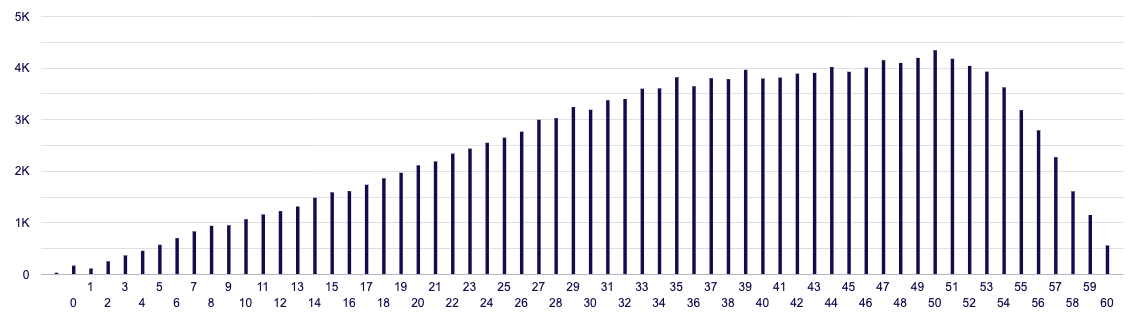
You’ll notice that the graph is skewed to the right, showing that the majority of students are having a positive experience. Only around 500 students achieved full marks, so there’s still an opportunity for the top attainers to be challenged.
The average mark was 36.51 out of a total of 60 available marks. This remains fairly consistent with previous years, with a slight increase in average mark over time (35.78 in 2023, 36.27 in 2024).
Overall, we see:
- 25% of students scored 48 or higher.
- 50% of students scored 38 or higher.
- 75% of students scored 27 or higher.
Topic performance
Looking at performance by topic, Adding and Rounding saw the most success, with students achieving 85% and 76% of marks, respectively.
The weakest topic was Area and Perimeter, with only 37% of marks achieved. We’ll explore this topic in more detail through the question-level analysis to understand the most common mistakes students are making.
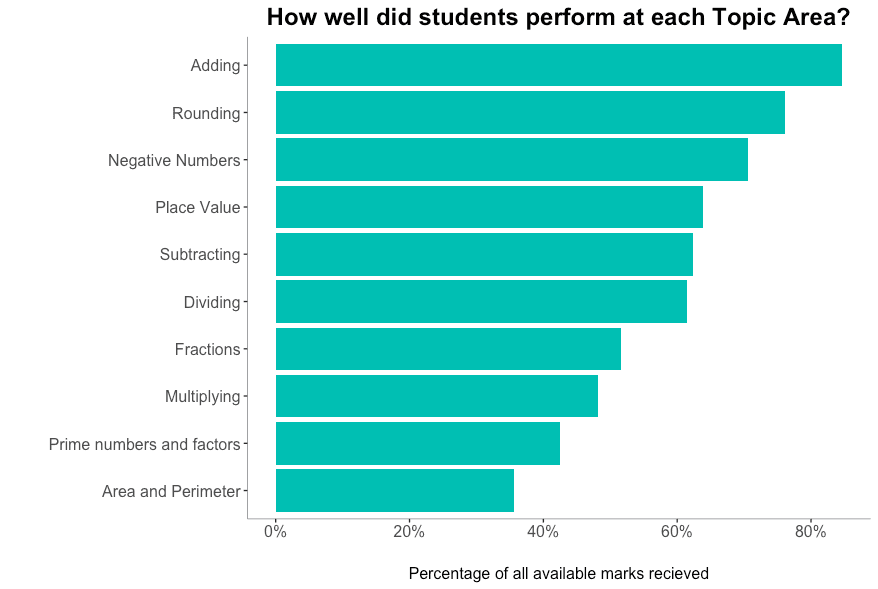
How does this compare to what you saw in your school? Did your cohort have any particularly strong topic areas compared to the national picture? Are there topic areas worth spending more time on as students move into the KS3 curriculum?
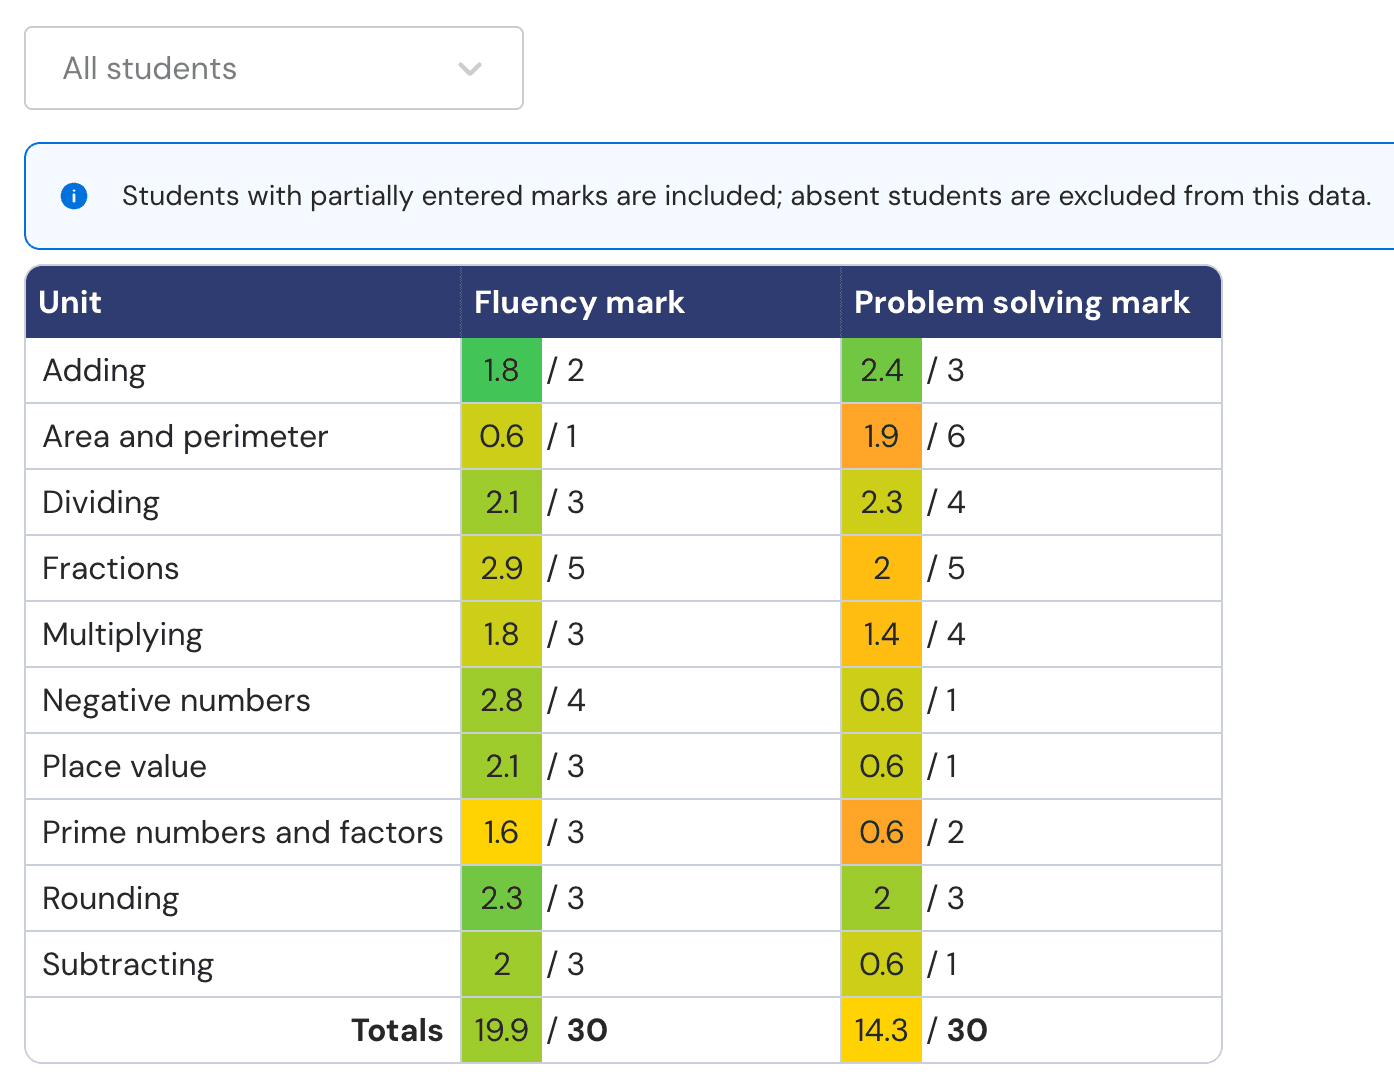
Splitting the data by fluency and problem-solving shows a similar pattern of topic difficulty across both question types.
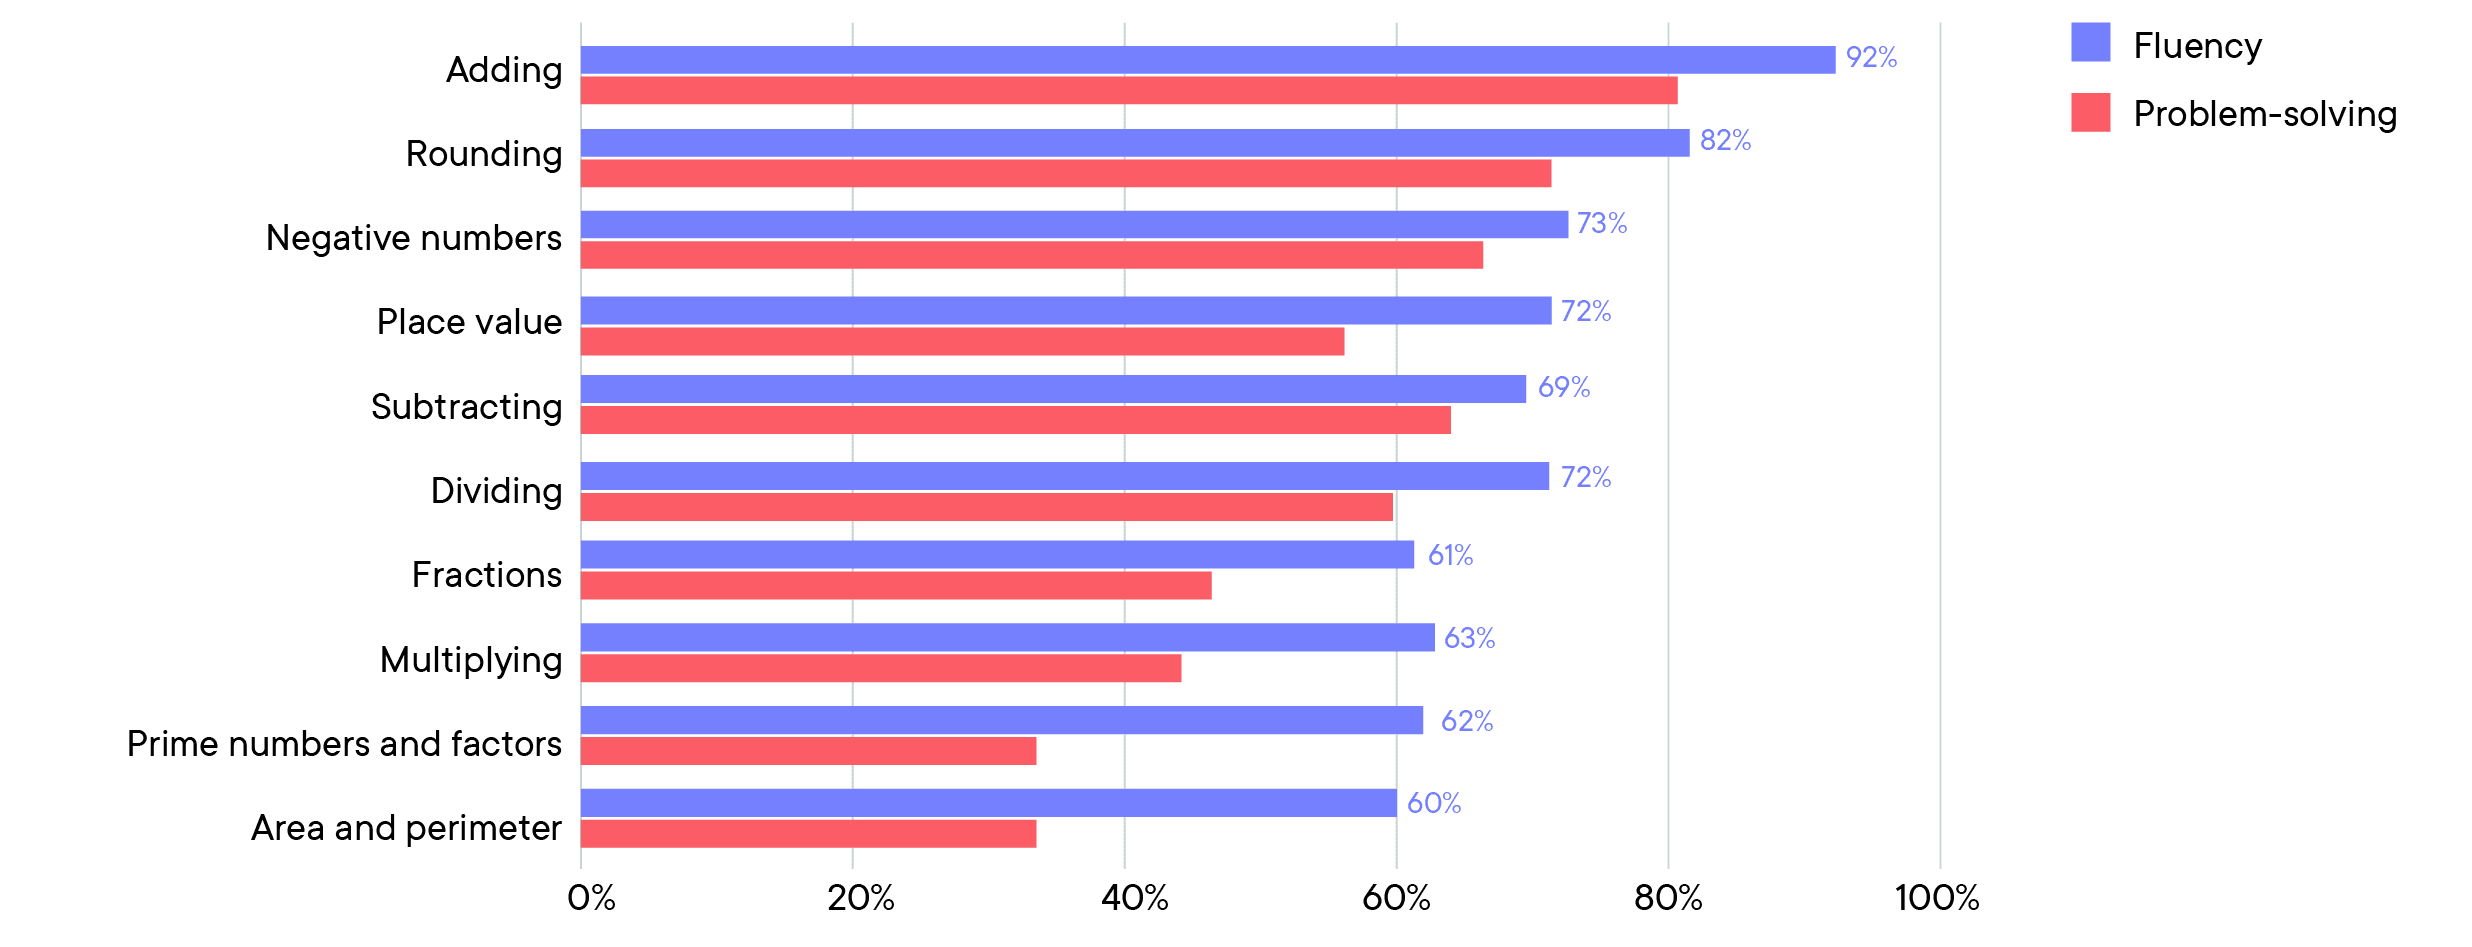
Overall students performed much better on fluency questions. On average, 21 out of 30 were awarded for fluency, compared with 15.5 out of 30 for problem-solving.
Question performance
Taking a look at a question level, we can see that the average performance on the questions decreases as the paper progresses (as we would expect based on the assessment design). However, one or two of the earlier questions were more challenging than anticipated.
The first question that stands out is Q3.
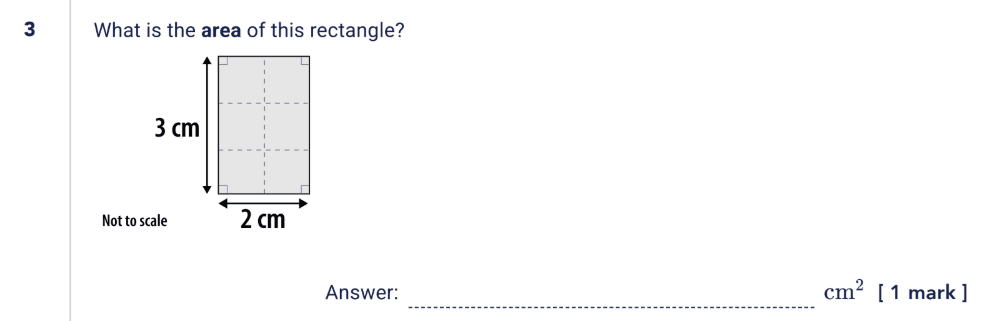
60% of students achieved this mark for calculating the area, but the most common incorrect response from the remaining 40% was 10 (39% of incorrect answers).
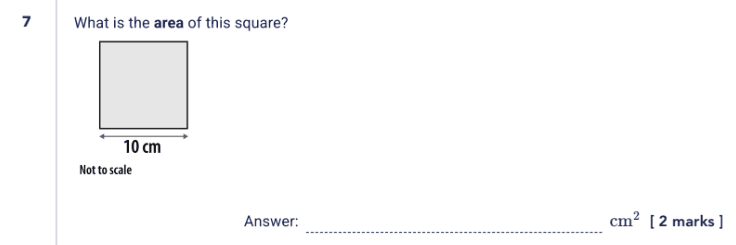
This error comes from calculating the perimeter rather than the area, a misconception we can see replicated across the other questions within this topic. For example in Q7, the most common incorrect answer is 40 (37% of incorrect answers), again indicating confusion between area and perimeter. This is another area where we have implemented hints for students.
Later in the paper, students encounter a question on the perimeter of a compound shape.
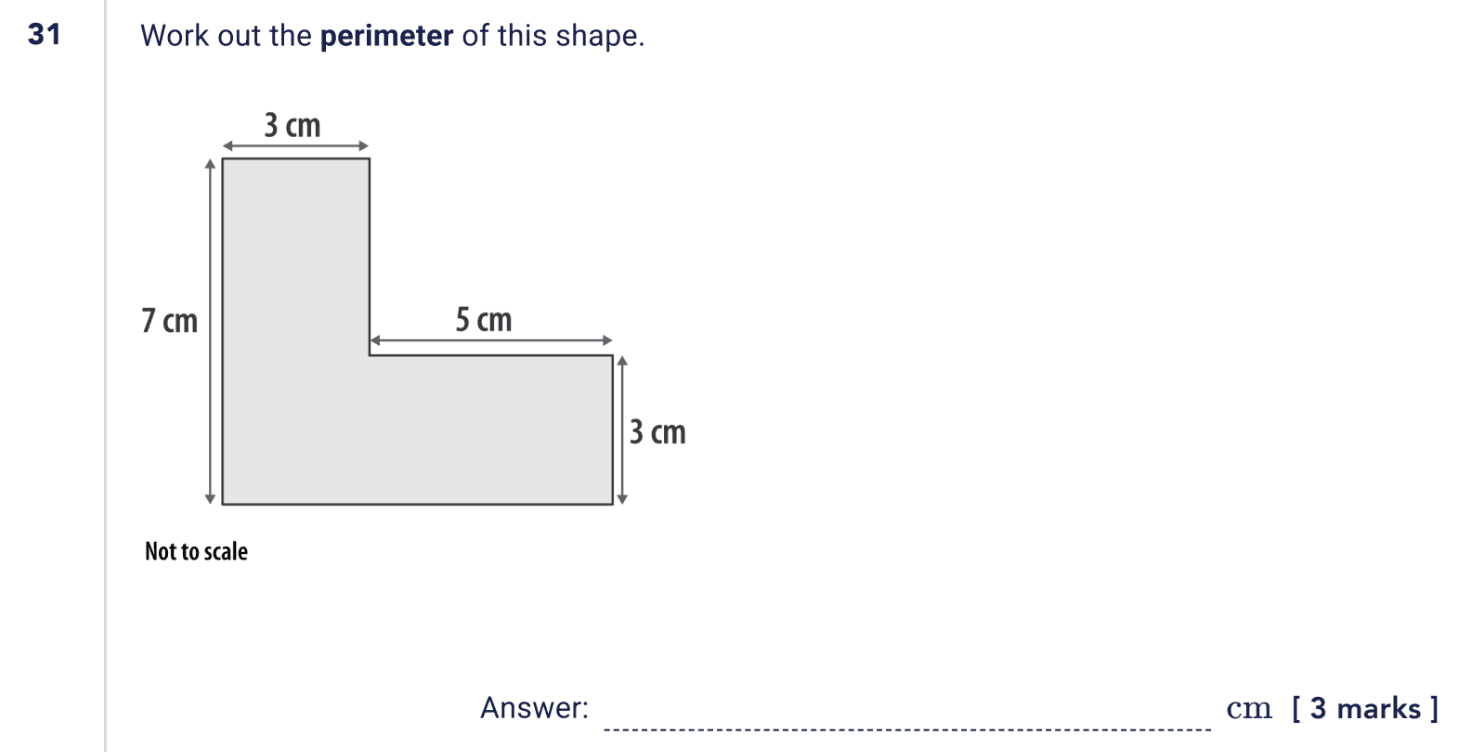
From the 580,000+ attempts in Sparx Maths Homework, we see the most common incorrect answer is from not including the missing vertical side length when calculating the perimeter. This particular answer accounts for 48% of the incorrect answers .
You’ll recognise this question from the first part of the blog. Insights like these have been instrumental in shaping the Hints project. When a student demonstrates a common mistake or misconception, we provide a quick, targeted nudge in the right direction to help them spot and correct their error.
This is especially effective when students have completed most of the question correctly, but stumble on the final step. So far we’ve delivered 1.8 million hints, ranging from reminders to simplify their answer to prompts about three-digit notation for bearings.
The impact of closing gaps
Since the assessment, teachers have been switching on the Fix-Up functionality for their students. So far, students have engaged with 150,000 fix-up questions, and 86% of these questions have been successfully corrected.
It’s incredibly encouraging to see this high success rate when students engage with their personalised fix-up work, and it’s fantastic to see those gaps being repaired. Given this success, we’re really keen to ensure as many students as possible engage with their fix-up work. We’d love to hear your experiences: How have you implemented Fix-Up in your school? How have you held students to account?
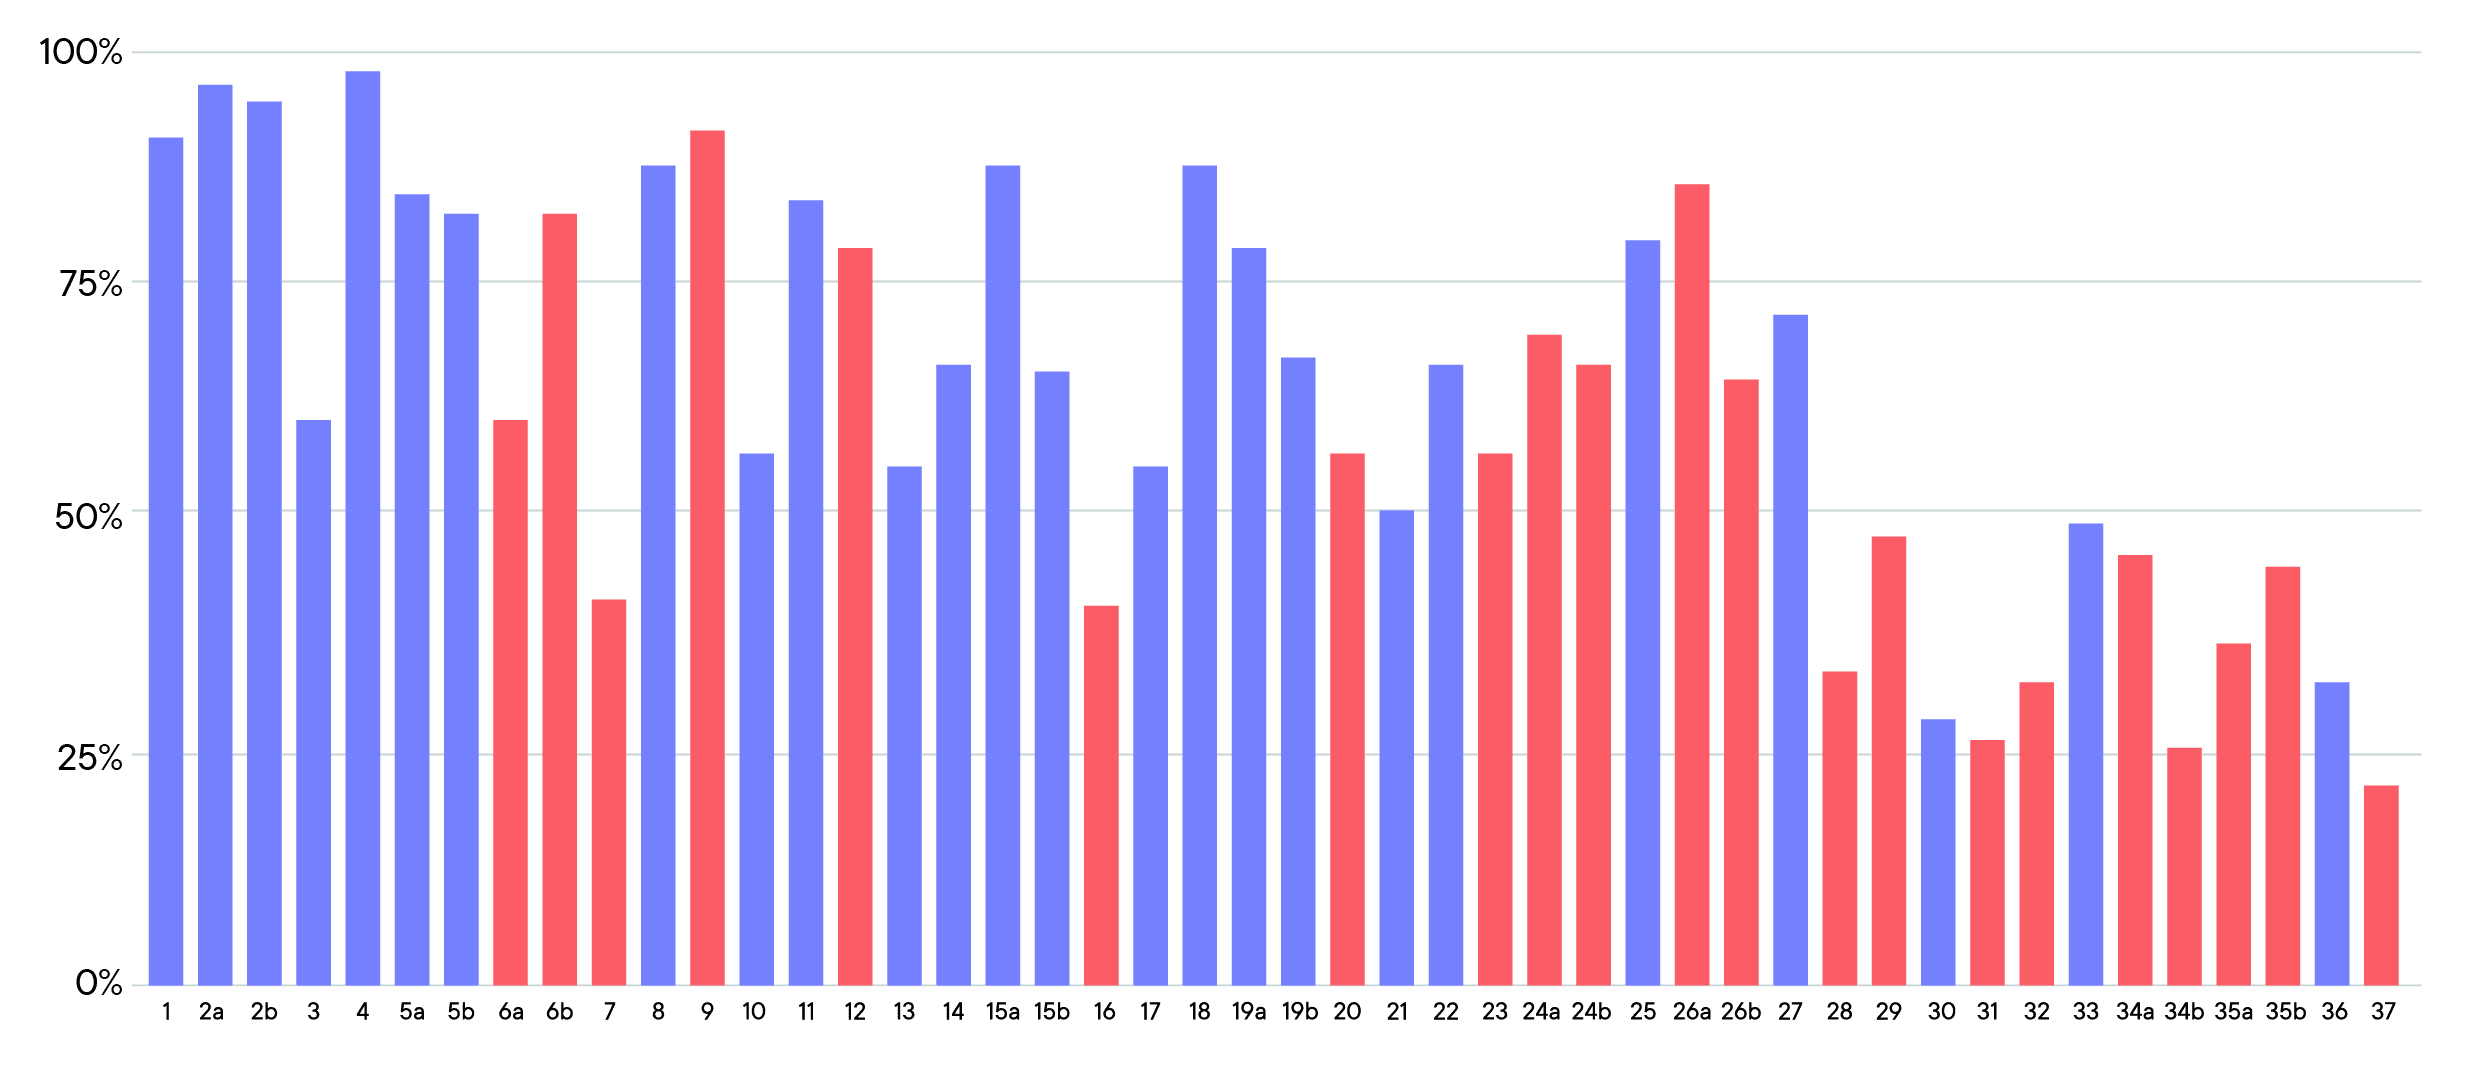
The graph below shows the fix-up rate for each question.
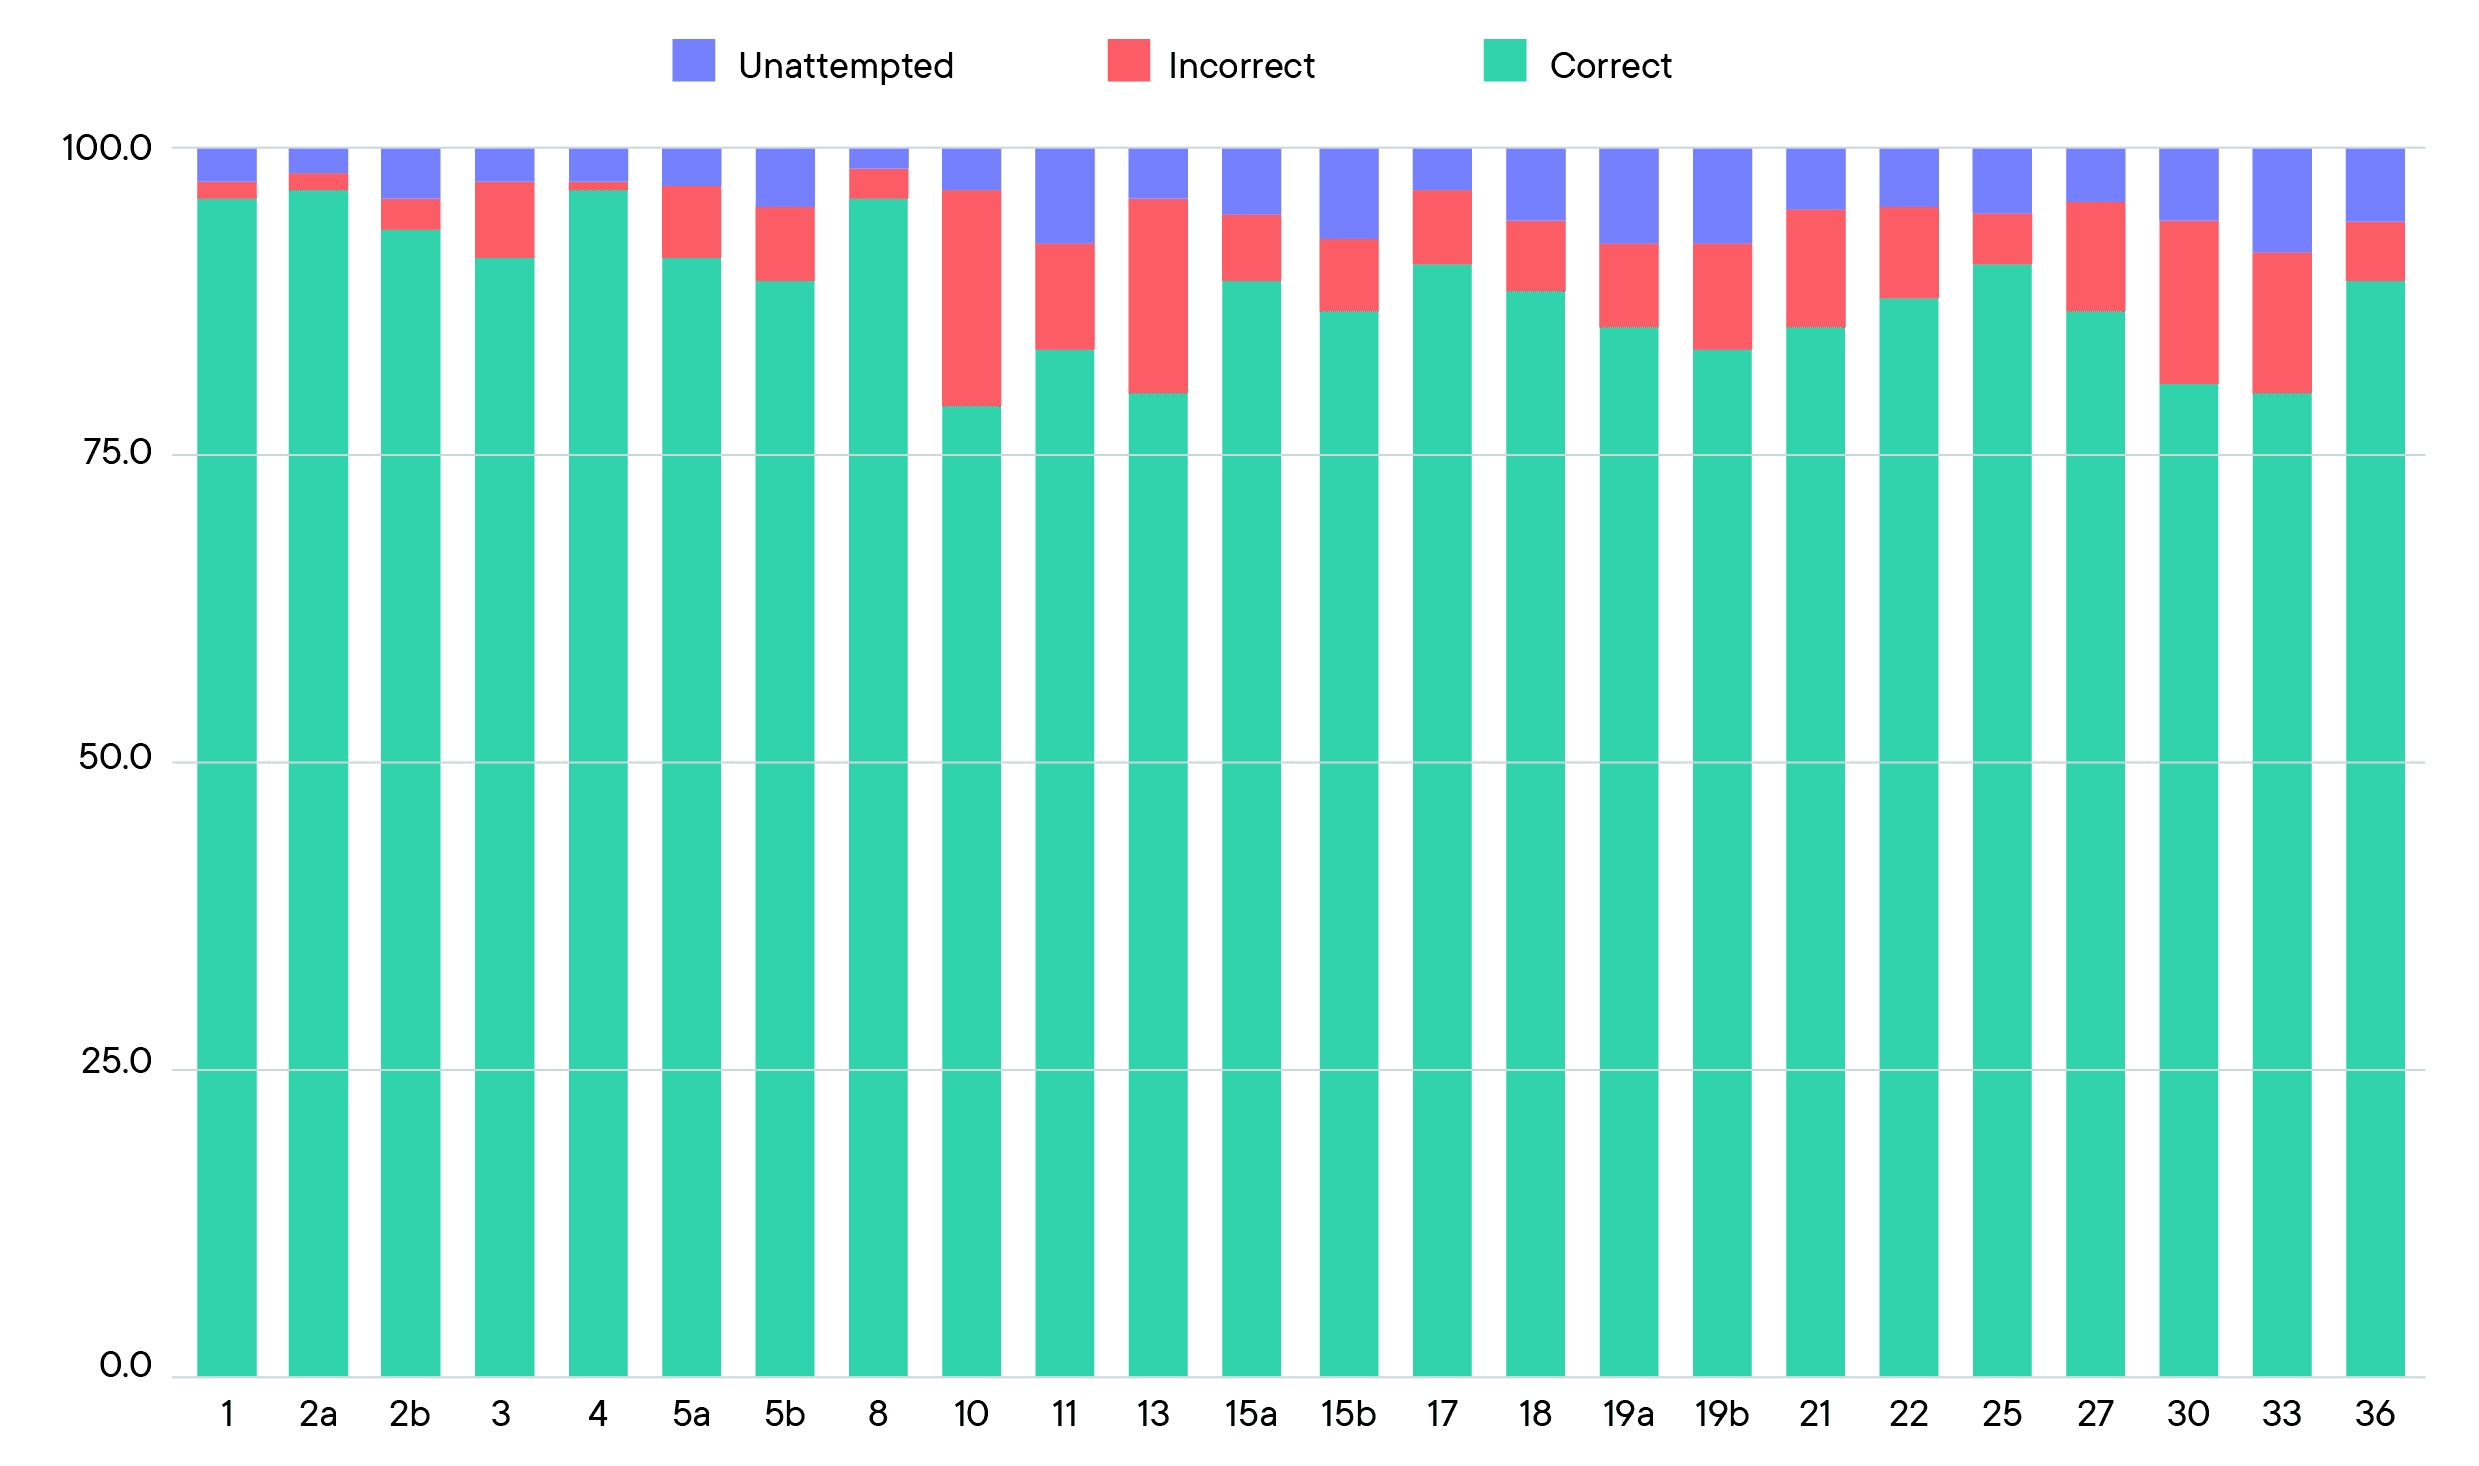
What can we learn from the question-level data? Are there particular questions or topics that are trickier for students to fix-up independently?
Two linked questions that stand out are Q10 and Q30.
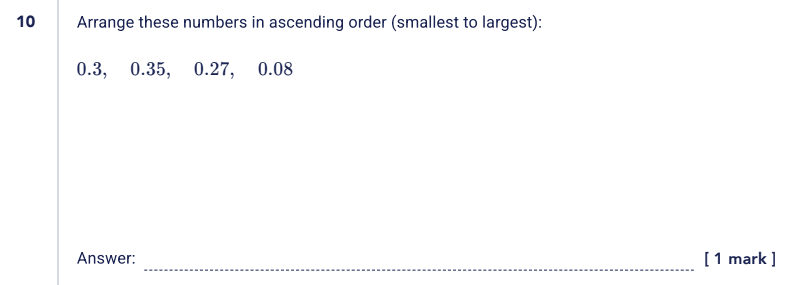
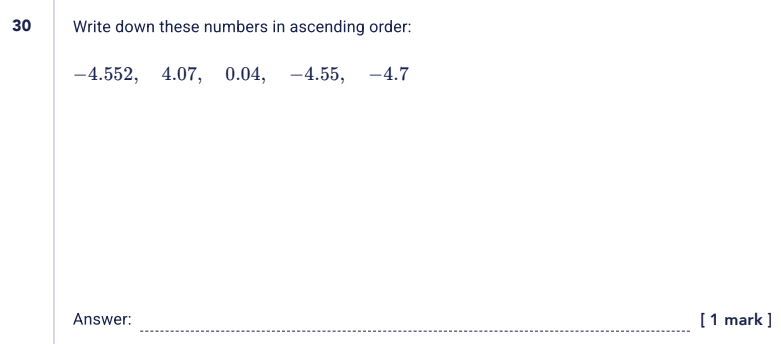
Both of these questions rely on an understanding of decimal place value, suggesting this could be a worthwhile focus area for further support.
What next?
From the start of this project, our aim has been to equip teachers with the tools to help students build a secure toolkit of essential skills at the start of Year 7.
We wanted to give students the agency to resolve their own misconceptions and teachers and leaders the detailed data to have meaningful conversations, adjust planning, and target intervention effectively.
This year’s data is just the beginning. We will continue refining our hints, support, and analysis to help every student build the confidence and motivation needed to succeed.