

- Sparx Maths
Beyond the results
 Amanda Whitehead|February 26, 2026
Beyond the results: Harnessing data for iterative assessment design (2 min read)
All of our assessments are carefully designed utilising data from the millions of question attempts on our homework platform. Answering questions under exam conditions brings unique challenges; by analysing our national assessment data we are gaining critical insights into where students may falter.
Adapt and improve
The data from the 14 000 students that sat the Year 9 Term 1 Sparx assessment in 2024 showed the distribution of marks was skewed to the left, and that the average mark was lower than anticipated at 21.3 out of 60.
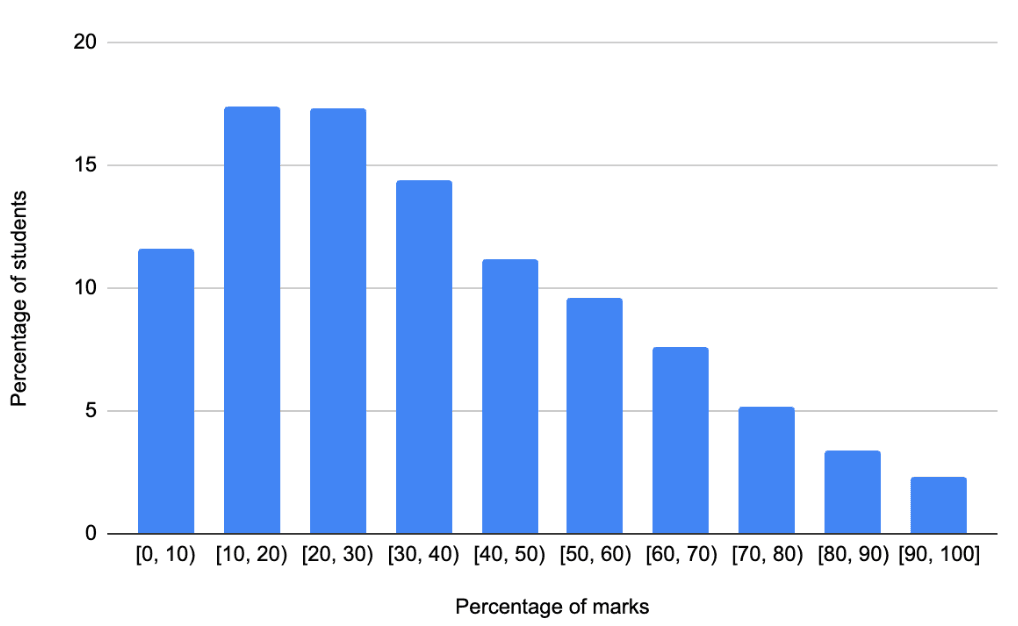
It’s important to us that students get a positive experience from sitting a Sparx assessment so we took a deep dive into the data to work out why and to improve the outcome.
Data insights
In 2025 nearly 25 000 students took the latest Year 9 Term 1 assessment and the data speaks for itself. Thoughtful changes to the question design and sequencing increased the average mark by 31% to 27.85, and the distribution has shifted to the right indicating a more positive experience for more students.
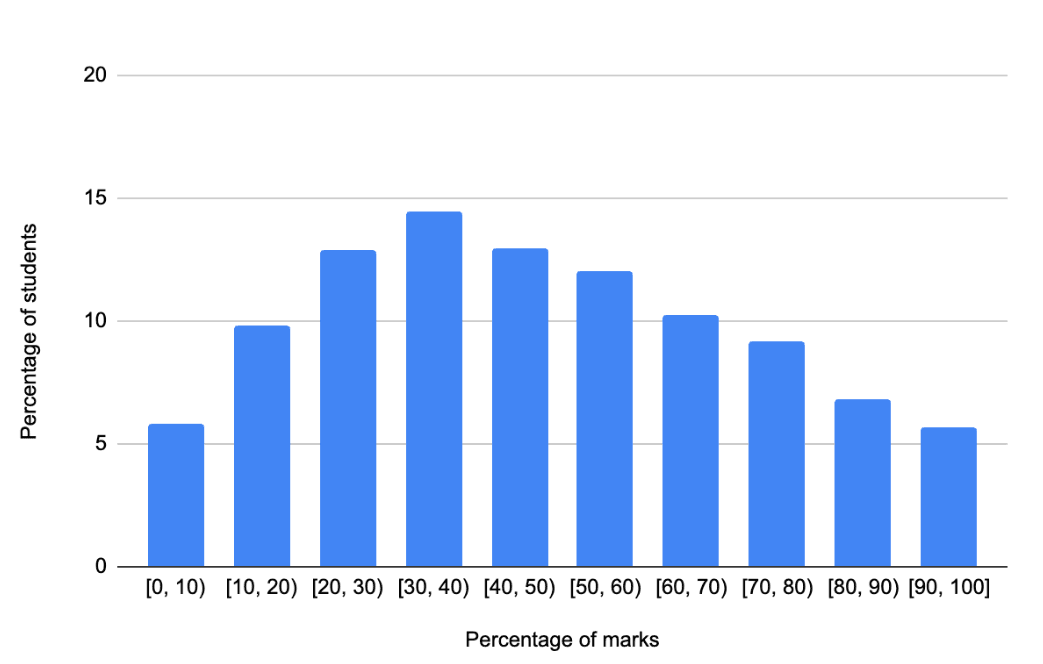
So, how was this achieved?
Building confidence
Fundamental skills from building blocks topics were included at the start to help students gain confidence and experience success early on. This also had the advantage of highlighting any fundamental gaps in knowledge to teachers.

For example, we added this question on converting FDP, which students first encounter in Y7T3, and underpins the percentage change and and probability they study in Y9.
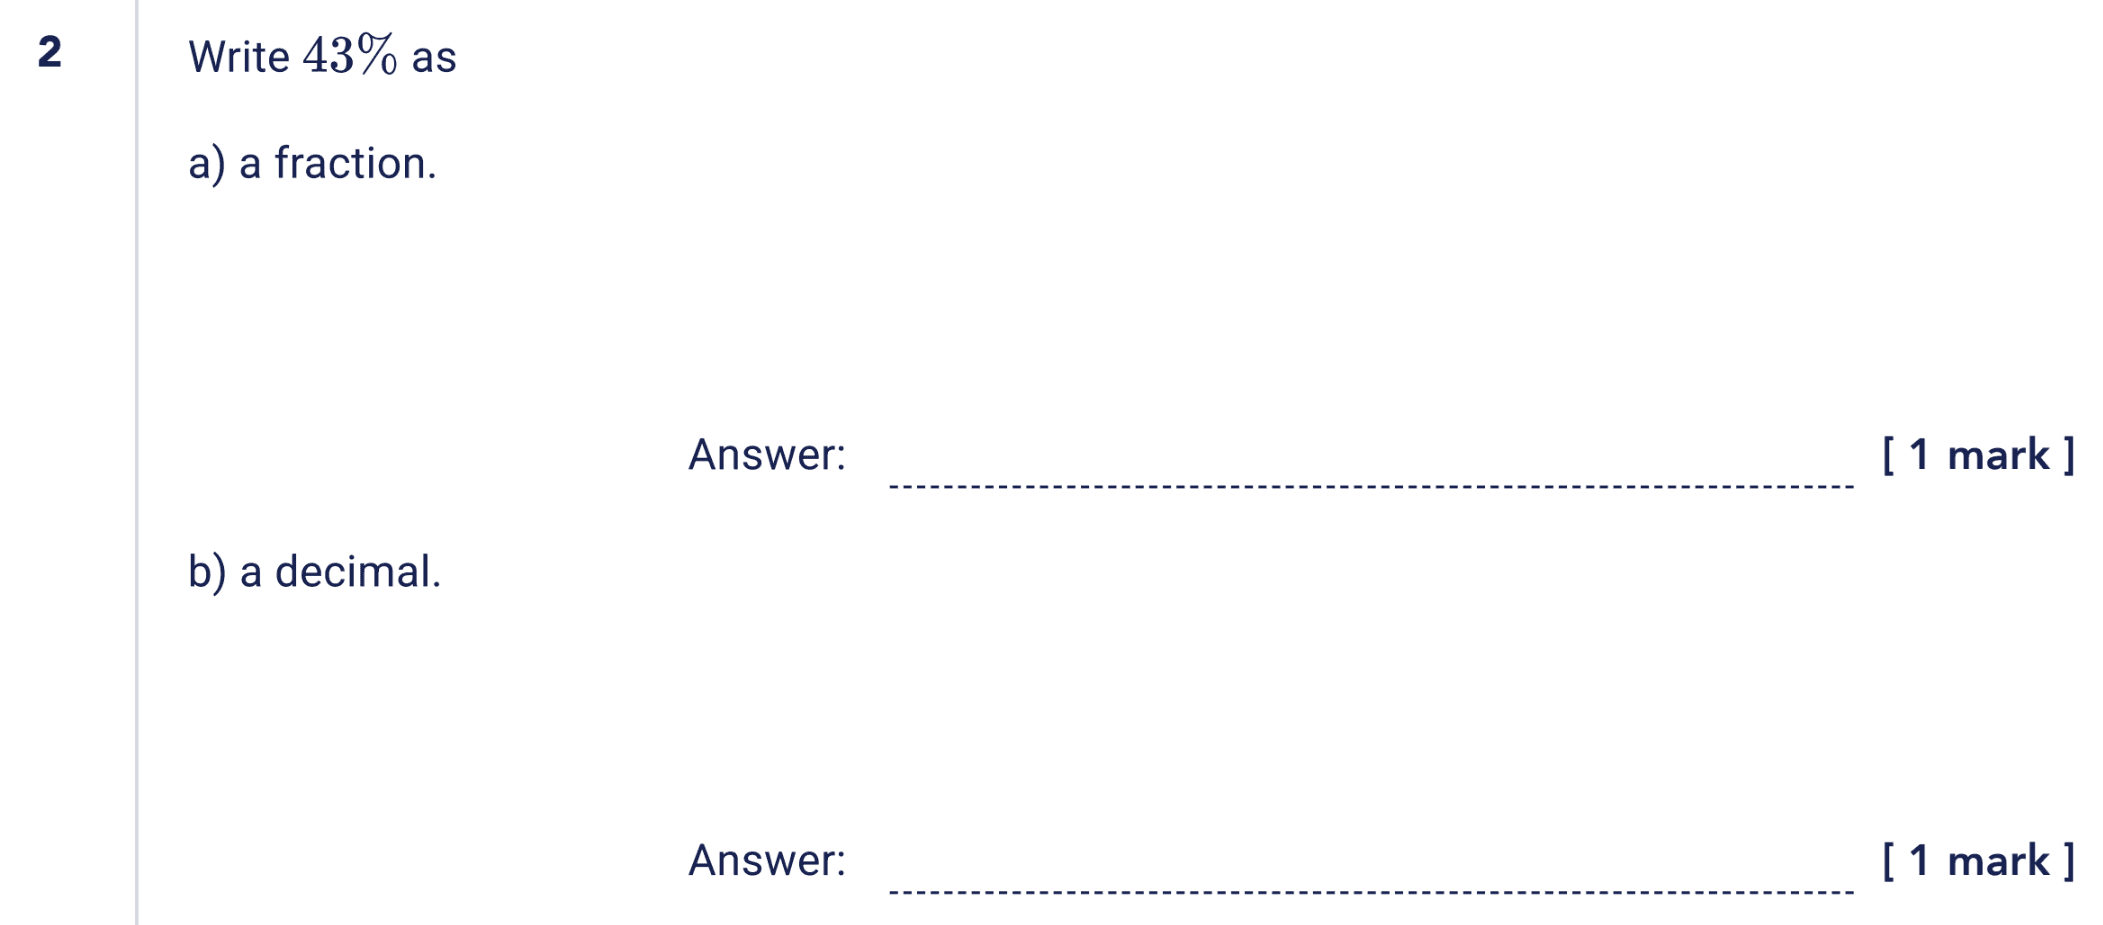
90% of students were successful in this question.
Fixing questions that broke the flow
Students that struggle in the middle of the paper lose confidence quickly. We identified that students stumbled over question 15 and 17 in 2024.
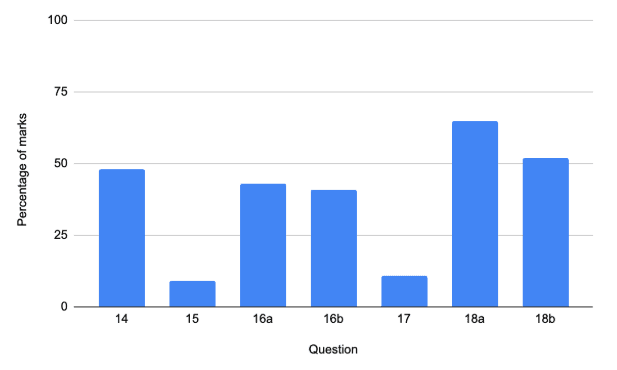

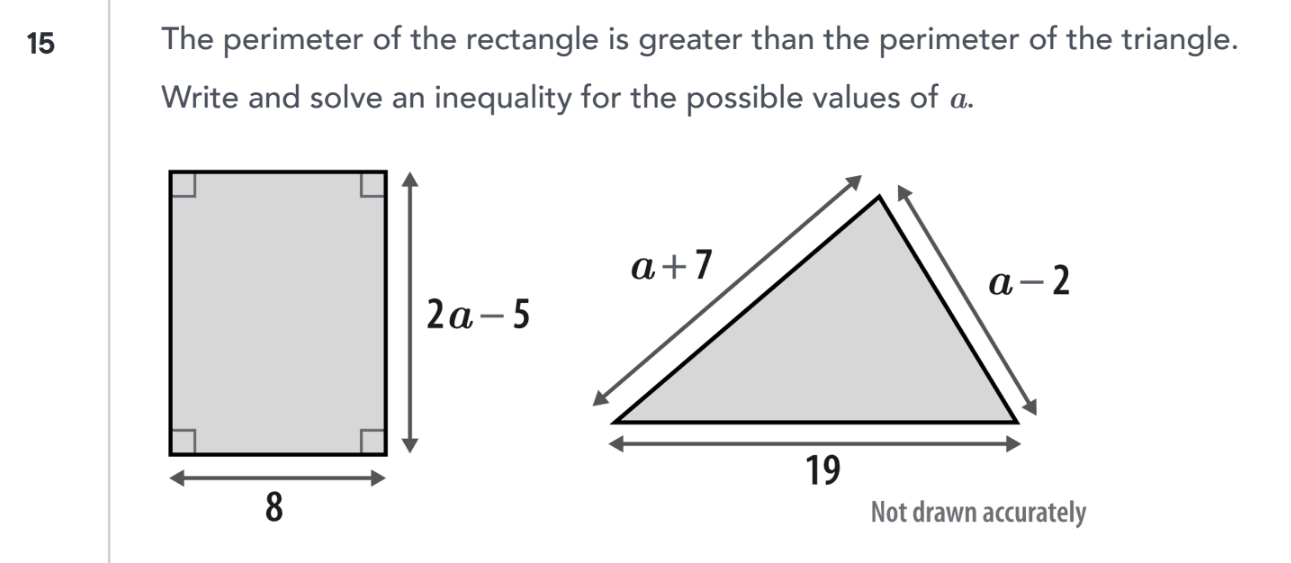
These questions were either replaced with similar questions, while ensuring the same skills were tested, or moved to later in the paper, to better reflect the way exams increase in difficulty.
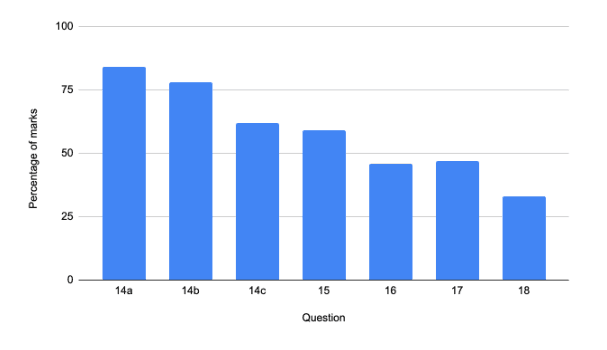
Once again the data from the 2025 cohort showed promising results.
Preserving the challenge
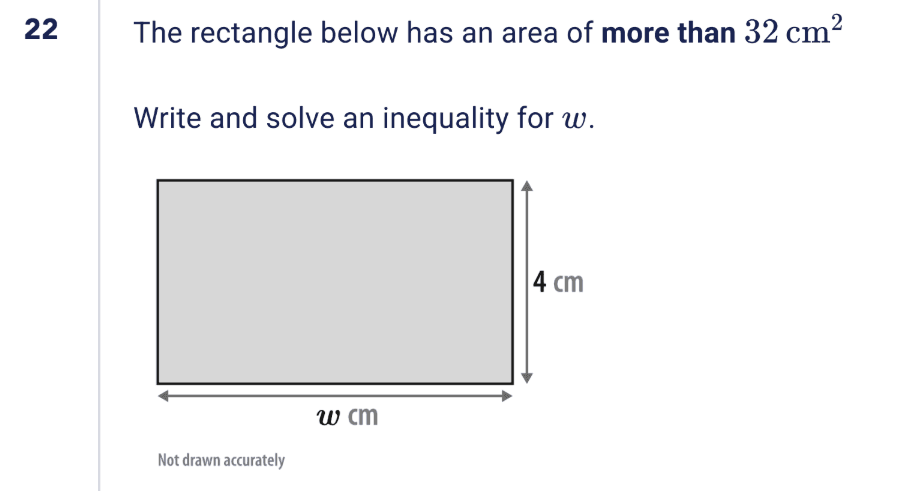
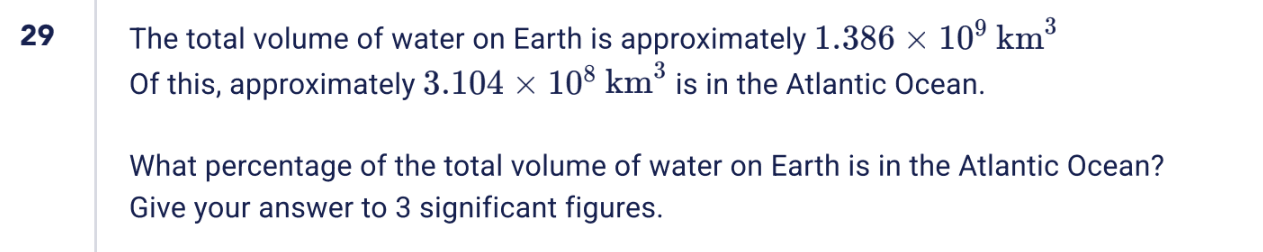
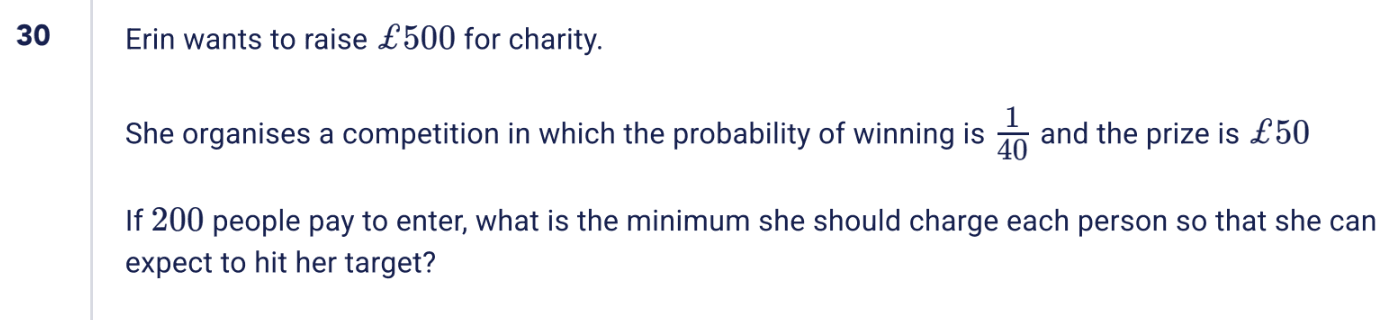
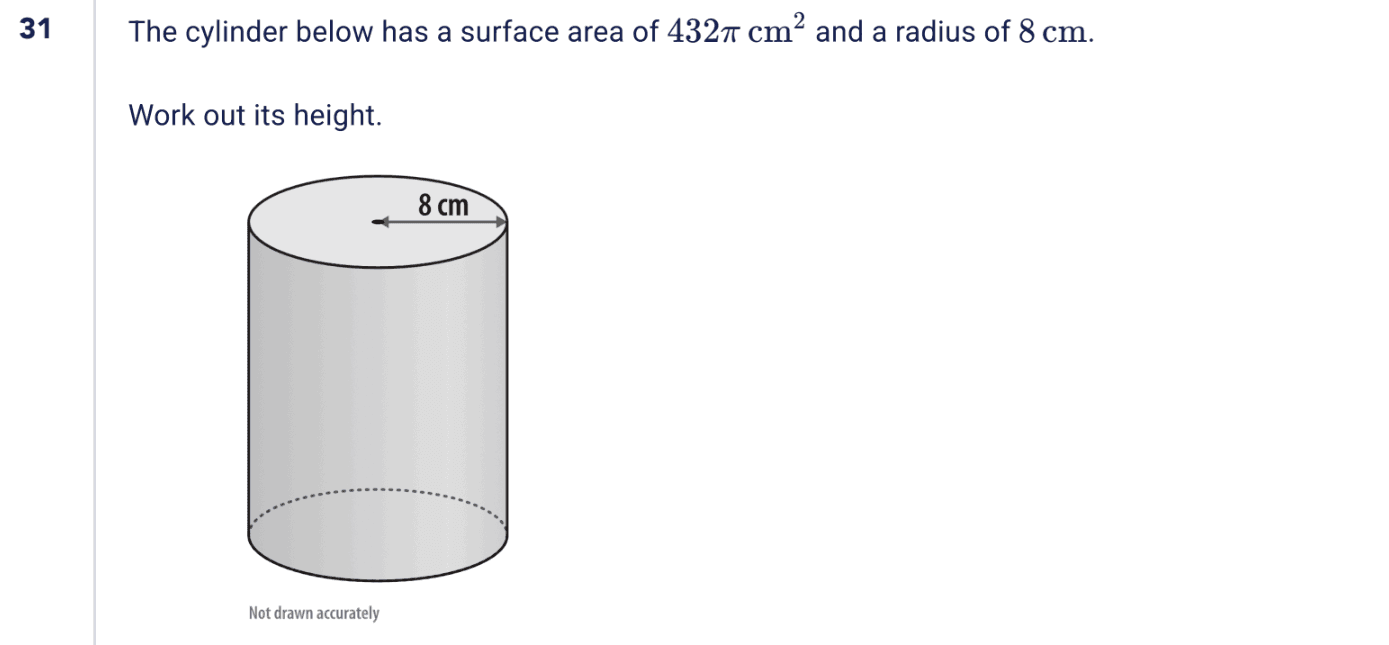
We were careful not to increase average marks at the expense of challenging the higher attainers, so we made sure that the problem solving at the end continued to really get them thinking. We can see from the mark distribution that only a small proportion of students achieved the top results which is exactly what we would expect.
Below are the final two questions on the paper. On average students scored 13% and 11% of the marks on these questions respectively.
Data driven, student centred design
Ultimately our data tells a story, we’re not just looking at numbers; we’re looking for ways to make our assessments more informative for teachers and a more positive experience for students. Adapting and evolving is at the heart of what we do and we are excited to keep turning these insights into action.